
- Home >
- Free Stock Photos & Images >
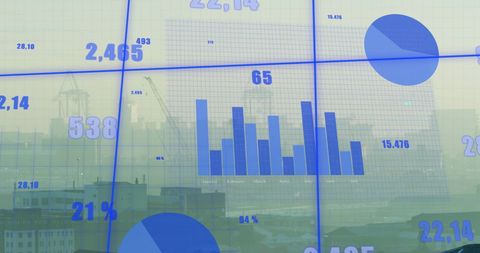
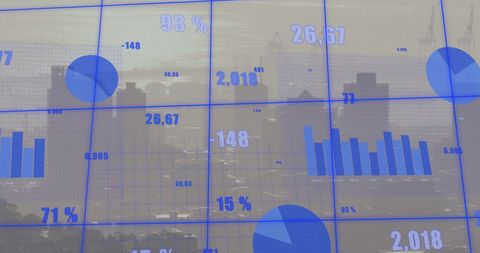
- Neon Data Dashboard Displaying Dynamic Analytics Grid with Bar Chart Pie Chart Metrics
Neon Data Dashboard Displaying Dynamic Analytics Grid with Bar Chart Pie Chart Metrics Free Stock Image

Showing neon grid with colorful data points, numeric labels, bar chart and pie chart for modern analytics visuals. Featuring deep blue background with bright cyan, magenta and green accents creating high-contrast futuristic look. Suitable for presenting dashboard concepts, pitch decks, website hero banners, fintech and data science articles, corporate reports and marketing campaigns. Working well as header art for business intelligence platforms, background for UI mockups or visual element in social media posts and presentations. Allowing designers to overlay logos, text or data callouts while preserving readability thanks to structured layout and strong focal elements.
Powered by  - Get 15% off with code: PIKWIZARD15


downloads
Tags:
More
Credit Photo
If you would like to credit the Photo, here are some ways you can do so
Text Link
photo Link
<span class="text-link">
<span>
<a target="_blank" href=https://pikwizard.com/photo/neon-data-dashboard-displaying-dynamic-analytics-grid-with-bar-chart-pie-chart-metrics/bd5f346573b558d797da457a576fc522/>PikWizard</a>
</span>
</span>
<span class="image-link">
<span
style="margin: 0 0 20px 0; display: inline-block; vertical-align: middle; width: 100%;"
>
<a
target="_blank"
href="https://pikwizard.com/photo/neon-data-dashboard-displaying-dynamic-analytics-grid-with-bar-chart-pie-chart-metrics/bd5f346573b558d797da457a576fc522/"
style="text-decoration: none; font-size: 10px; margin: 0;"
>
<img src="https://thumbs.wbm.im/pw/medium/bd5f346573b558d797da457a576fc522.jpg" style="margin: 0; width: 100%;" alt="Neon Data Dashboard Displaying Dynamic Analytics Grid with Bar Chart Pie Chart Metrics" />
<p style="font-size: 12px; margin: 0;">PikWizard</p>
</a>
</span>
</span>
Free (free of charge)
Free for personal and commercial use.
Author: People Creations
Similar Free Stock Images


Premium


Premium


Premium


Premium


Premium


Premium


Premium


Premium


Premium


Premium


Premium


Premium


Premium


Premium


Premium


Premium


Premium


Premium


Premium


Premium


Premium


Premium


Premium


Premium


Premium

Explore More Free Stock Images