- Home >
- Stock Photos >
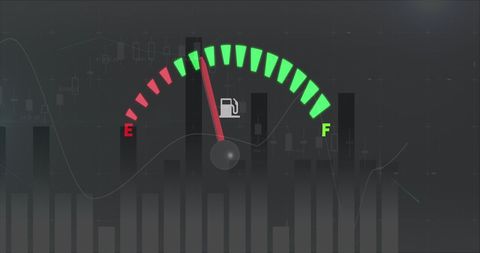
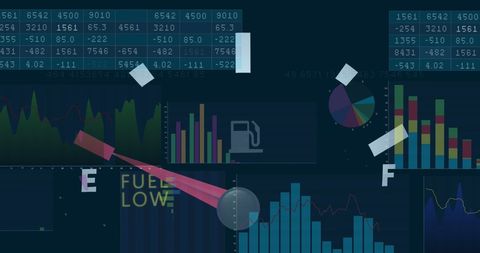
- Neon Data Graph Overlay on Car Dashboard Concept Display
Neon Data Graph Overlay on Car Dashboard Concept Display Image
Dynamic representation of data processing superimposed on a digital car panel, reflecting global business and finance themes. Suitable for illustrating concepts of analytics, data-driven decision making, technology in automotive industry, and futuristic interfaces. Ideal for use in business presentations, finance reports, marketing materials, and technology-related publications.
Powered by  - Get 15% off with code: PIKWIZARD15


2
downloads
downloads
Tags:
More
Credit Photo
If you would like to credit the Photo, here are some ways you can do so
Text Link
photo Link
<span class="text-link">
<span>
<a target="_blank" href=https://pikwizard.com/photo/neon-data-graph-overlay-on-car-dashboard-concept-display/7518d3d6746a888c76ab3dd998238fad/>PikWizard</a>
</span>
</span>
<span class="image-link">
<span
style="margin: 0 0 20px 0; display: inline-block; vertical-align: middle; width: 100%;"
>
<a
target="_blank"
href="https://pikwizard.com/photo/neon-data-graph-overlay-on-car-dashboard-concept-display/7518d3d6746a888c76ab3dd998238fad/"
style="text-decoration: none; font-size: 10px; margin: 0;"
>
<img src="https://pikwizard.com/pw/medium/7518d3d6746a888c76ab3dd998238fad.jpg" style="margin: 0; width: 100%;" alt="" />
<p style="font-size: 12px; margin: 0;">PikWizard</p>
</a>
</span>
</span>
Free (free of charge)
Free for personal and commercial use.
Author: People Creations
Similar Free Stock Images

Premium


Premium


Premium


Premium


Premium


Premium


Premium


Premium


Premium


Premium


Premium


Premium


Premium


Premium


Premium


Premium


Premium


Premium


Premium


Premium

Premium


Premium


Premium


Premium


Premium