- Home >
- Stock Photos >
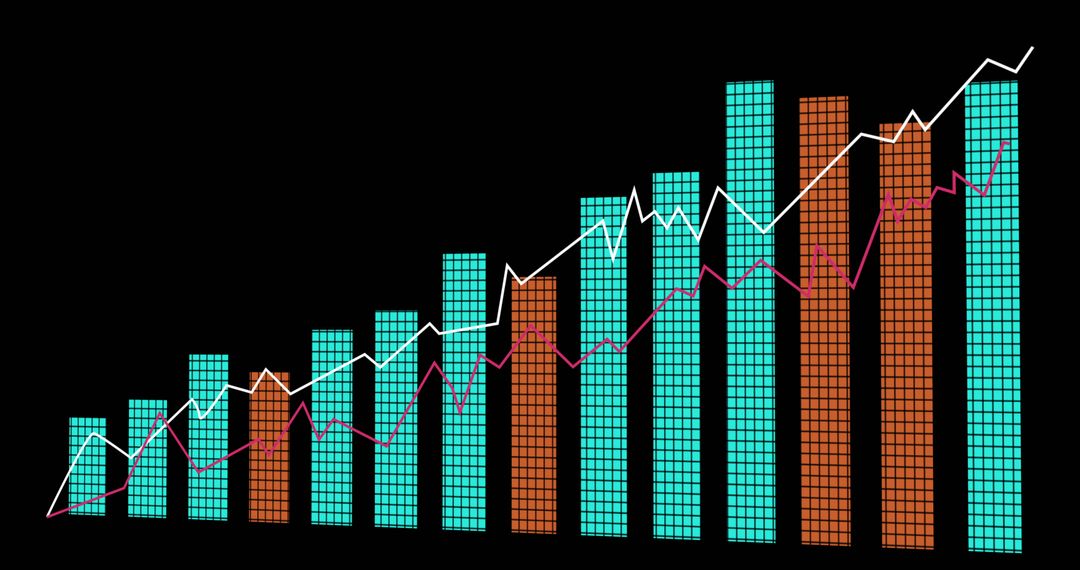
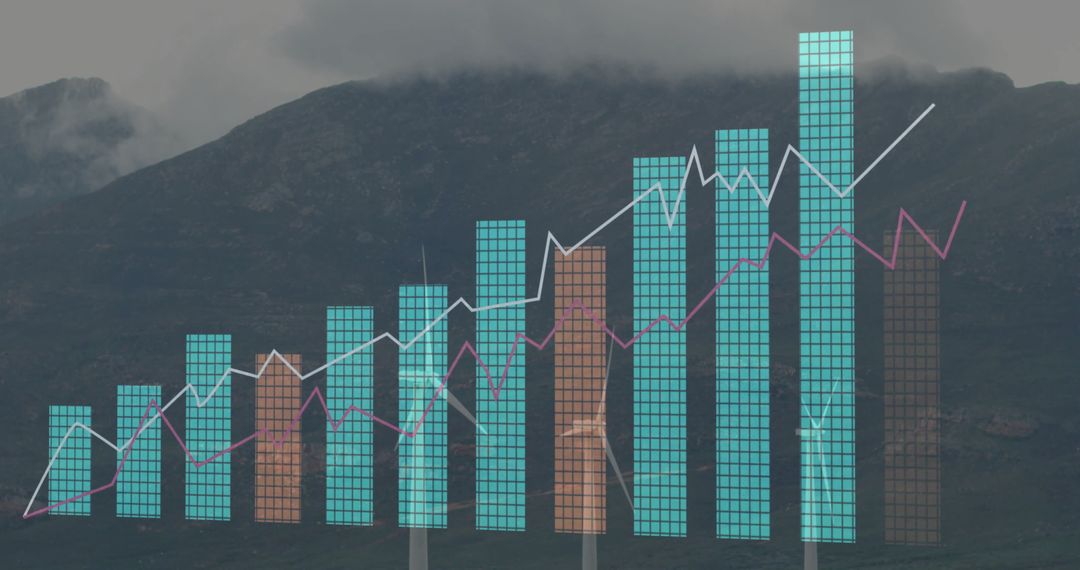
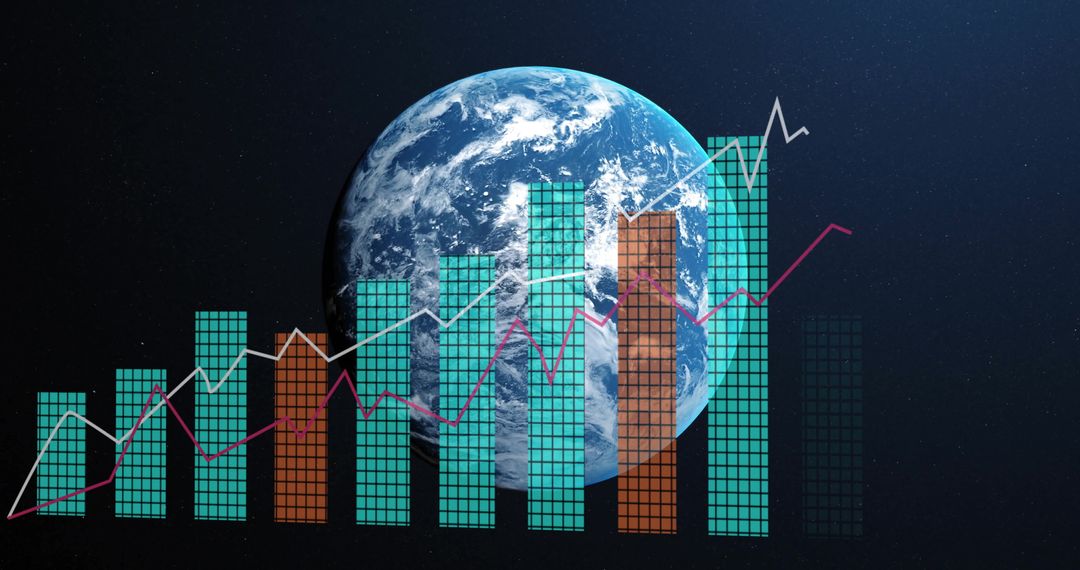
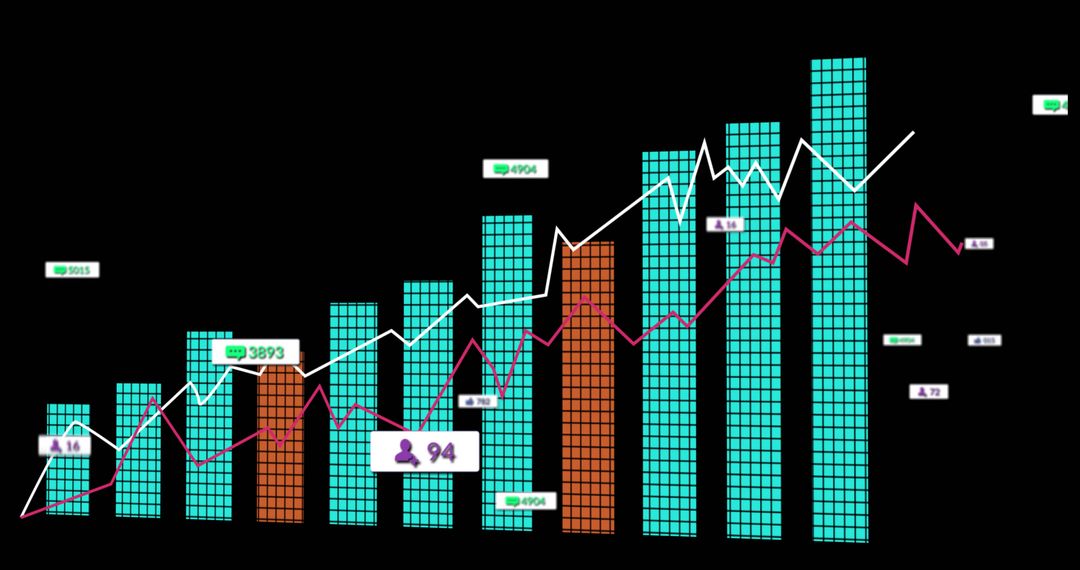
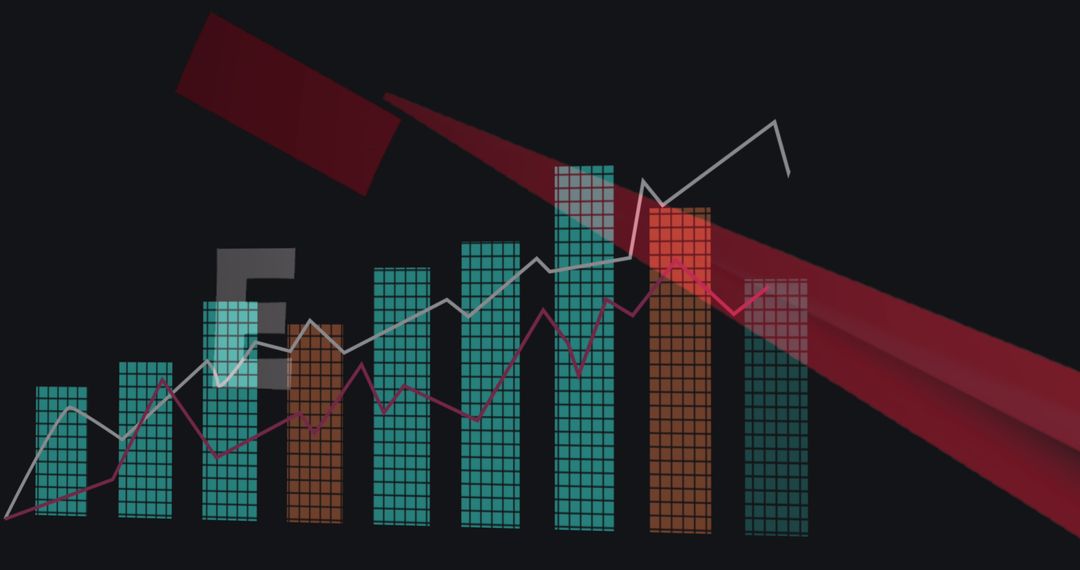
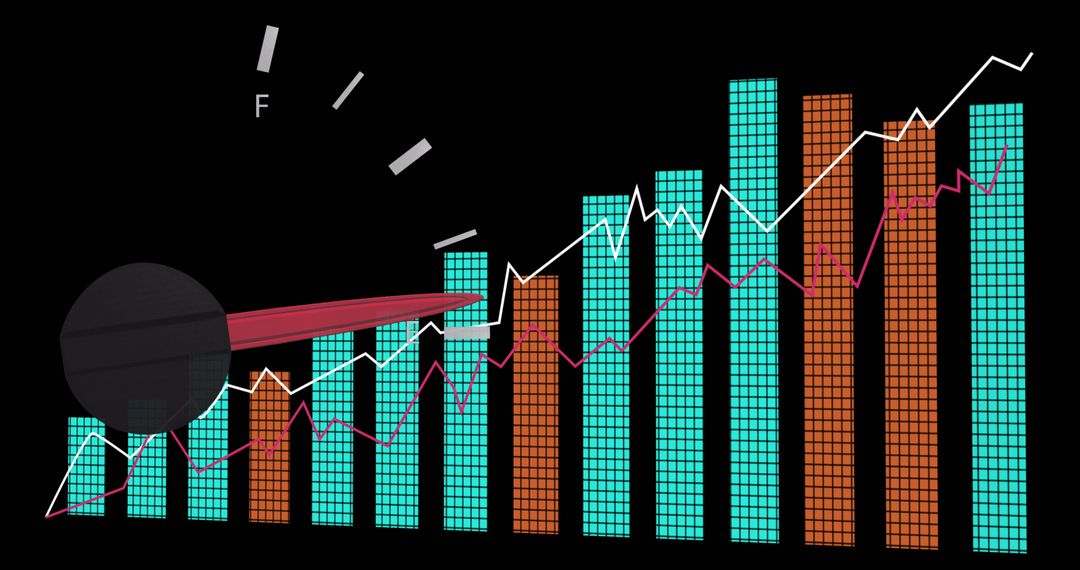
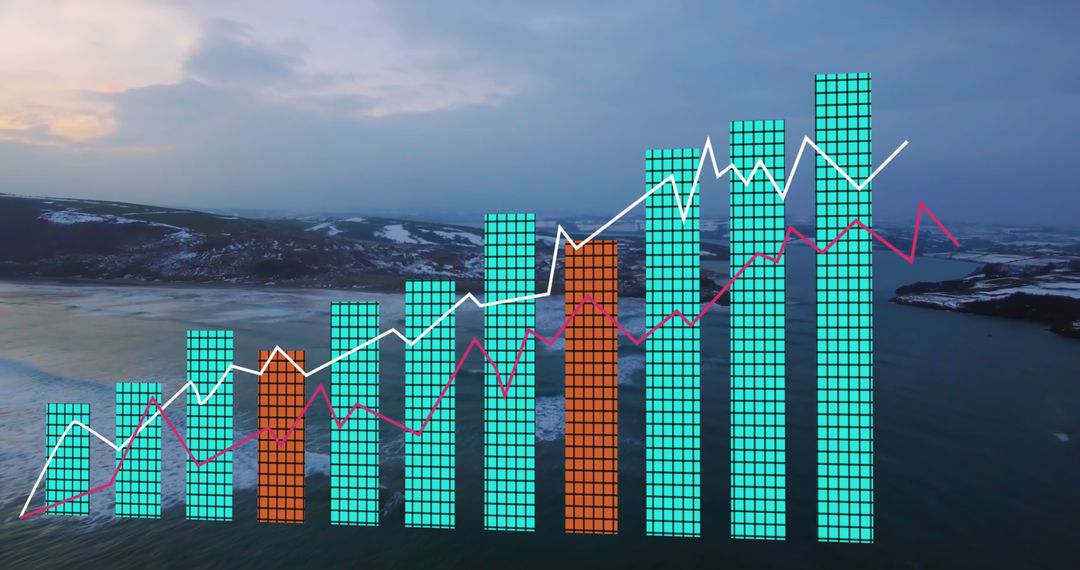
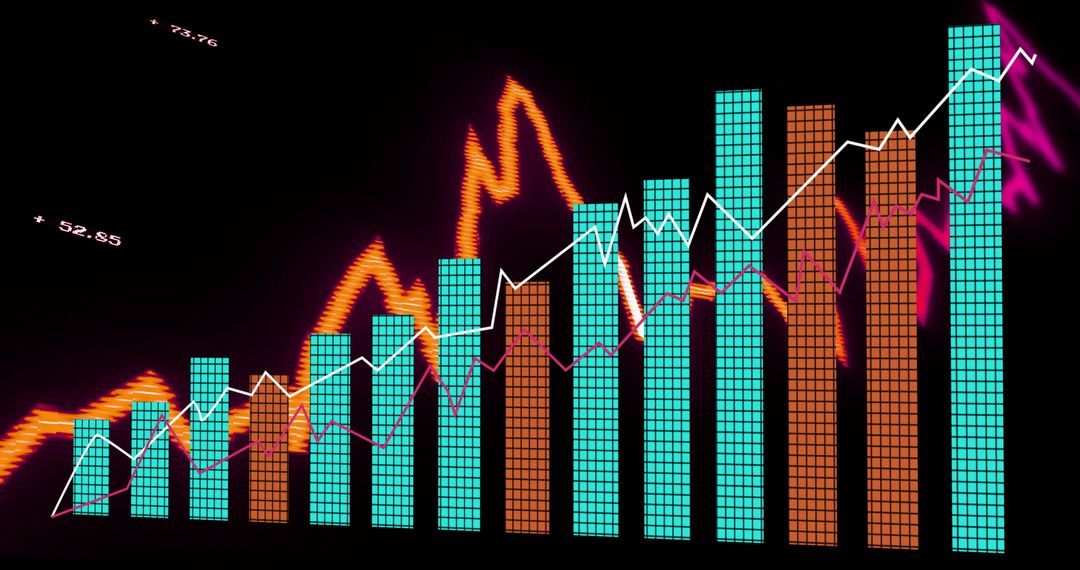
- Neon data viz showing glowing vertical grid bars with white and magenta trend lines
Neon data viz showing glowing vertical grid bars with white and magenta trend lines Image

Showing turquoise and orange vertical grid bars with white and magenta trend lines against dark bokeh backdrop. Highlighting upward growth patterns and fluctuating metrics for finance, tech, marketing, or analytics content. Working well for website headers, presentation slides, investor decks, dashboard mockups, social media posts, and annual reports. Offering strong color contrast and neon glow for futuristic, digital brand messaging in fintech, cryptocurrency, startups, and data-driven campaigns. Leaving ample negative space for overlaying headlines, logos, icons, charts, or call-to-action elements. Suitable for editorial or commercial use where modern, high-tech dataviz visual is required.
Powered by 


0
downloads
downloads
Tags:
More
Credit Photo
If you would like to credit the Photo, here are some ways you can do so
Text Link
photo Link
<span class="text-link">
<span>
<a target="_blank" href=https://pikwizard.com/photo/neon-data-viz-showing-glowing-vertical-grid-bars-with-white-and-magenta-trend-lines/b2e81140cf33c2db4d2970c3bf4831f0/>PikWizard</a>
</span>
</span>
<span class="image-link">
<span
style="margin: 0 0 20px 0; display: inline-block; vertical-align: middle; width: 100%;"
>
<a
target="_blank"
href="https://pikwizard.com/photo/neon-data-viz-showing-glowing-vertical-grid-bars-with-white-and-magenta-trend-lines/b2e81140cf33c2db4d2970c3bf4831f0/"
style="text-decoration: none; font-size: 10px; margin: 0;"
>
<img src="https://pikwizard.com/pw/medium/b2e81140cf33c2db4d2970c3bf4831f0.jpg" style="margin: 0; width: 100%;" alt="" />
<p style="font-size: 12px; margin: 0;">PikWizard</p>
</a>
</span>
</span>
Free (free of charge)
Free for personal and commercial use.
Author: Awesome Content
Similar Free Stock Images

Premium


Premium


Premium


Premium


Premium


Premium


Premium


Premium


Premium


Premium


Premium


Premium


Premium


Premium


Premium


Premium


Premium


Premium


Premium


Premium


Premium


Premium


Premium


Premium