- Home >
- Stock Photos >
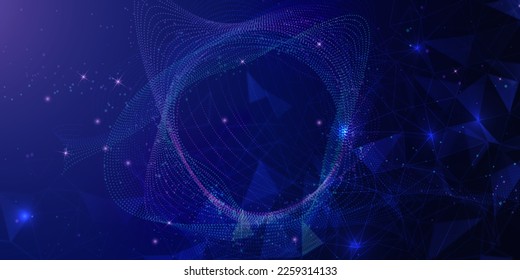
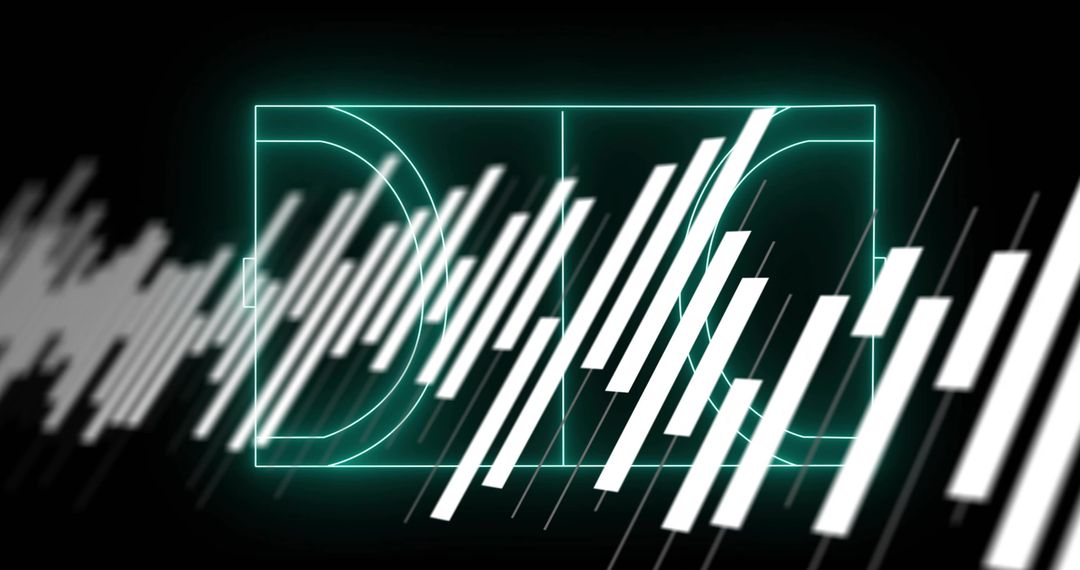
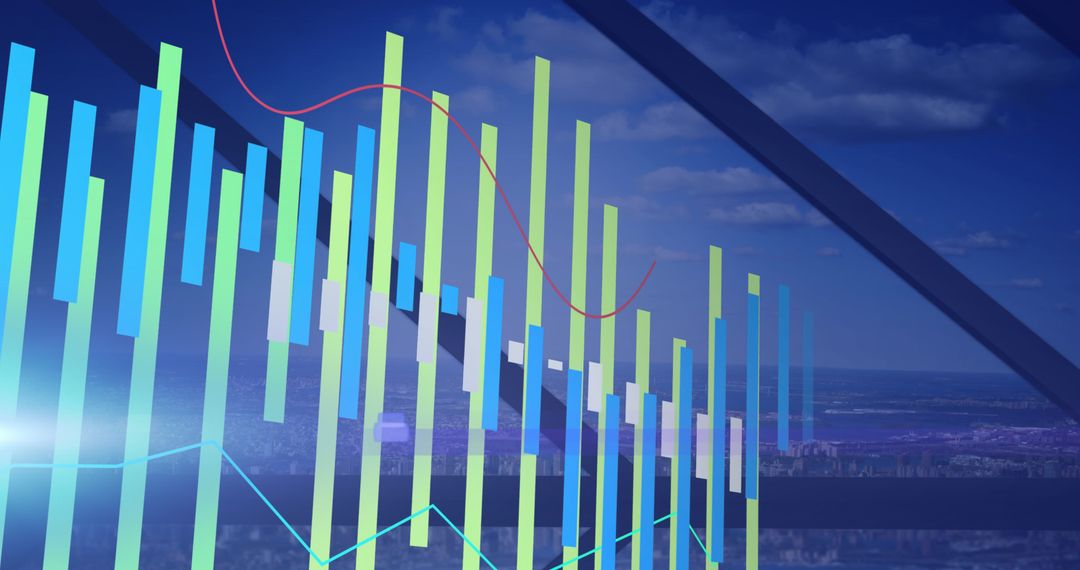
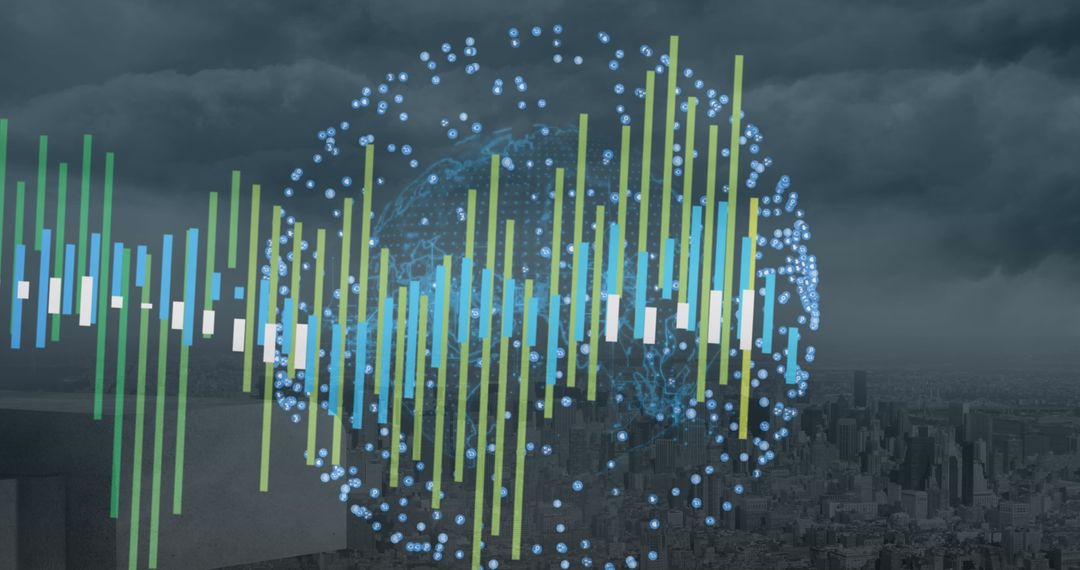
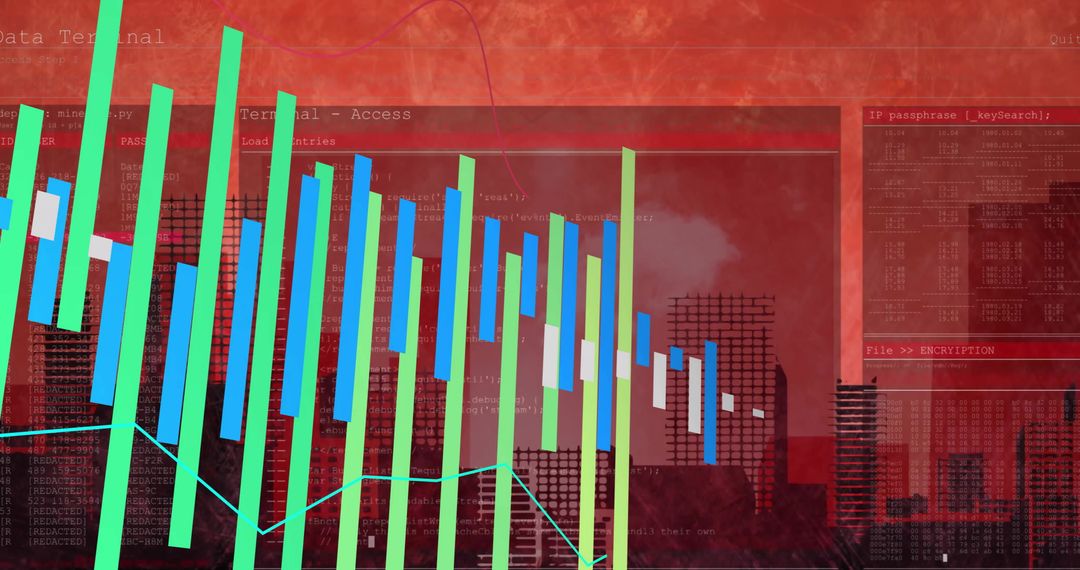
- Neon Datawave Graphic with Cyan Molecular Helix and Vertical Signal Bars for Tech Visuals
Neon Datawave Graphic with Cyan Molecular Helix and Vertical Signal Bars for Tech Visuals Image

Showing vertical white signal bars slicing across neon-cyan molecular helix and faint waveform overlays. Composition combining abstract data flows and network lattice with hexagonal motifs, creating futuristic tech aesthetic. Colour palette featuring neon cyan, deep black, crisp white and electric blue, delivering high-contrast digital look. Suiting technology presentations, AI and machine learning marketing, biotech and genomics reports, data analytics dashboards and cybersecurity or fintech branding. Working well for website hero banners, conference posters, slide headers, editorial spreads, social media ads and app backgrounds. Allowing text overlay in negative space and providing bold visual focal point for modern scientific or technical themes.
Powered by  - Get 15% off with code: PIKWIZARD15


0
downloads
downloads
Tags:
More
Credit Photo
If you would like to credit the Photo, here are some ways you can do so
Text Link
photo Link
<span class="text-link">
<span>
<a target="_blank" href=https://pikwizard.com/photo/neon-datawave-graphic-with-cyan-molecular-helix-and-vertical-signal-bars-for-tech-visuals/a24f56a50fcf551f7b395b0e3718b634/>PikWizard</a>
</span>
</span>
<span class="image-link">
<span
style="margin: 0 0 20px 0; display: inline-block; vertical-align: middle; width: 100%;"
>
<a
target="_blank"
href="https://pikwizard.com/photo/neon-datawave-graphic-with-cyan-molecular-helix-and-vertical-signal-bars-for-tech-visuals/a24f56a50fcf551f7b395b0e3718b634/"
style="text-decoration: none; font-size: 10px; margin: 0;"
>
<img src="https://pikwizard.com/pw/medium/a24f56a50fcf551f7b395b0e3718b634.jpg" style="margin: 0; width: 100%;" alt="" />
<p style="font-size: 12px; margin: 0;">PikWizard</p>
</a>
</span>
</span>
Free (free of charge)
Free for personal and commercial use.
Author: Awesome Content
Similar Free Stock Images

Premium


Premium


Premium


Premium

Premium


Premium


Premium


Premium


Premium


Premium


Premium


Premium


Premium


Premium


Premium


Premium


Premium


Premium


Premium


Premium


Premium


Premium


Premium


Premium