
- Home >
- Stock Photos >
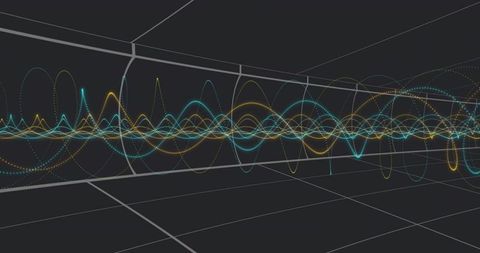
- Neon Digital Data Dashboard with Interactive Analytics Interface
Neon Digital Data Dashboard with Interactive Analytics Interface Image

This futuristic visualization depicts a digital data dashboard featuring luminous neon waves and candlestick bars on a dark interface. Data labels float against a hexagonal grid pattern, giving an advanced feel. This image is ideal for use in business analytics presentations, technology blogs, or innovative software advertising, showcasing cutting-edge data analytics and dashboard interfaces.
Powered by 


downloads
Tags:
More
Credit Photo
If you would like to credit the Photo, here are some ways you can do so
Text Link
photo Link
<span class="text-link">
<span>
<a target="_blank" href=https://pikwizard.com/photo/neon-digital-data-dashboard-with-interactive-analytics-interface/65742610467e13c95cf3363cef2c8940/>PikWizard</a>
</span>
</span>
<span class="image-link">
<span
style="margin: 0 0 20px 0; display: inline-block; vertical-align: middle; width: 100%;"
>
<a
target="_blank"
href="https://pikwizard.com/photo/neon-digital-data-dashboard-with-interactive-analytics-interface/65742610467e13c95cf3363cef2c8940/"
style="text-decoration: none; font-size: 10px; margin: 0;"
>
<img src="https://pikwizard.com/pw/medium/65742610467e13c95cf3363cef2c8940.jpg" style="margin: 0; width: 100%;" alt="" />
<p style="font-size: 12px; margin: 0;">PikWizard</p>
</a>
</span>
</span>
Free (free of charge)
Free for personal and commercial use.
Author: People Creations
Similar Free Stock Images

Premium


Premium

Premium


Premium


Premium


Premium


Premium


Premium


Premium


Premium


Premium


Premium


Premium


Premium


Premium

Premium


Premium


Premium


Premium


Premium

Premium


Premium


Premium


Premium


Premium


Explore More Free Stock Images