- Home >
- Stock Photos >
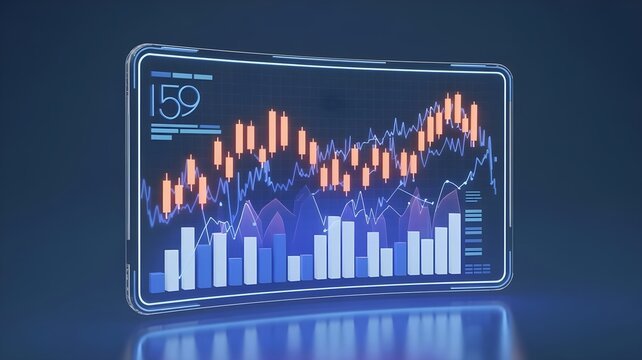
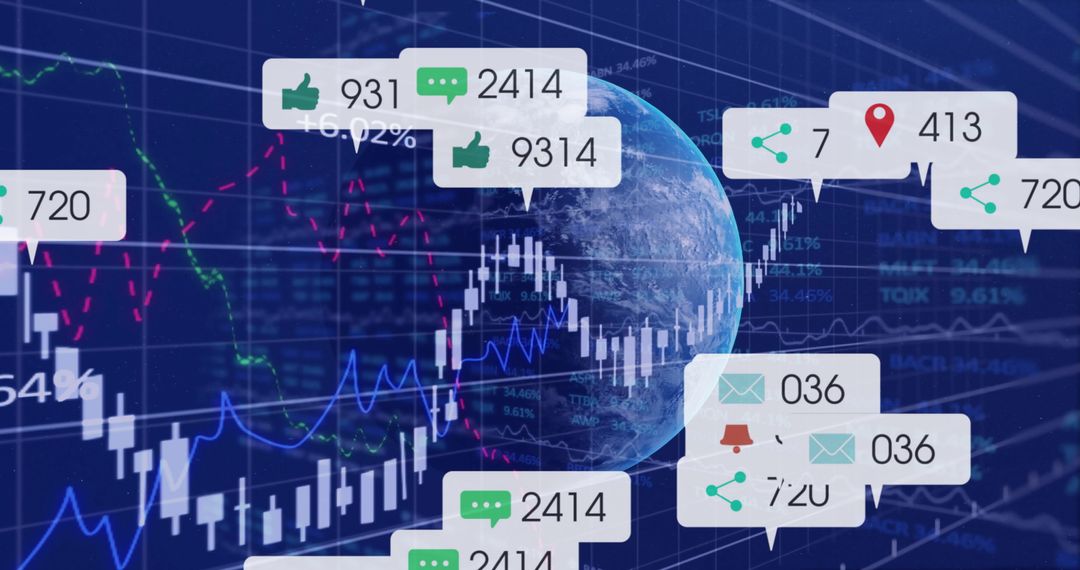
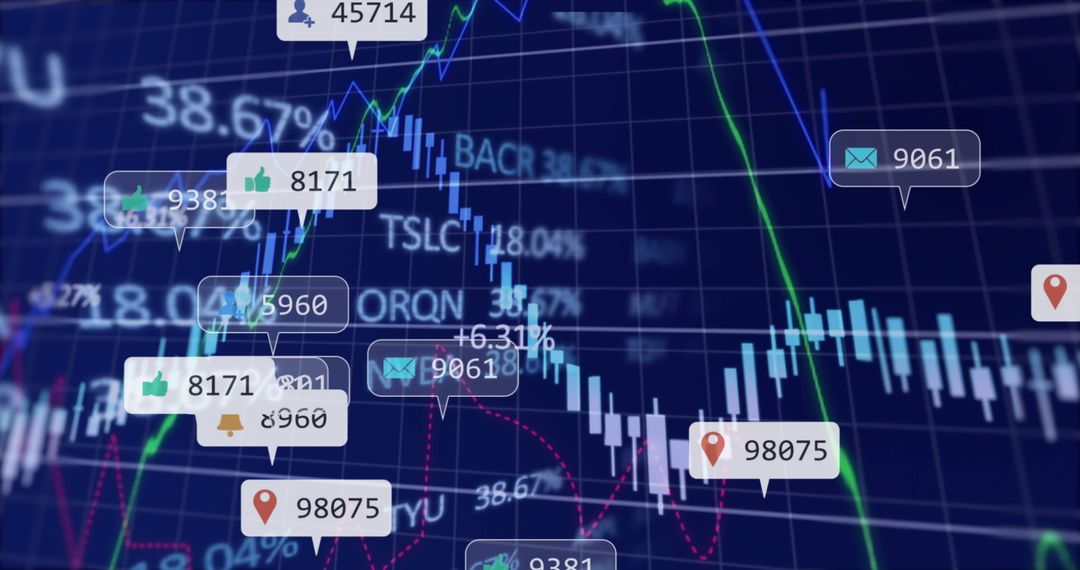
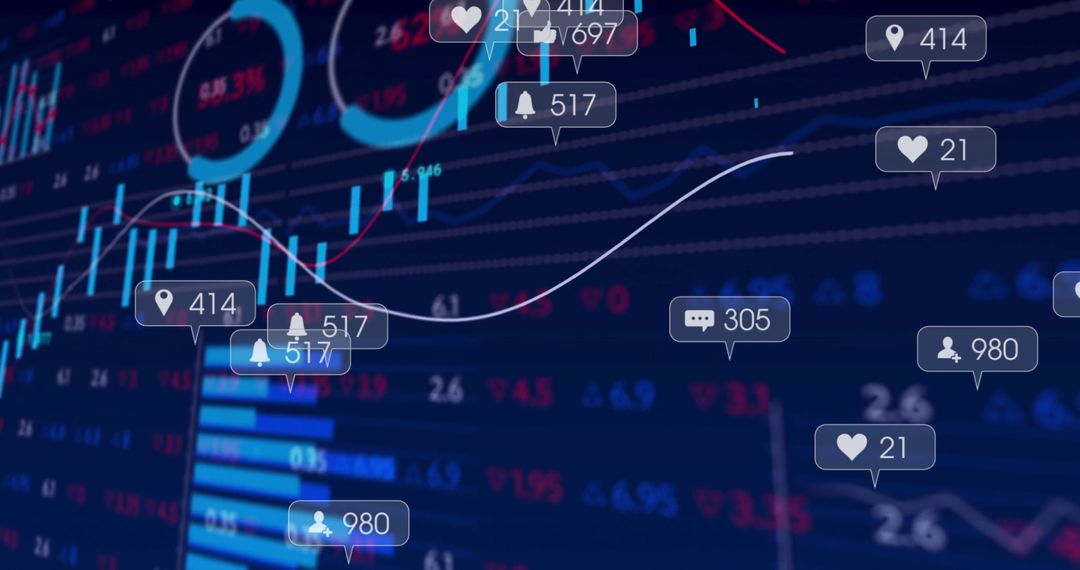
- Neon Finance Dashboard Displaying Live Market Charts with Interactive Data Bubbles
Neon Finance Dashboard Displaying Live Market Charts with Interactive Data Bubbles Image

Vivid neon finance dashboard displaying live market charts with red and blue trend lines, binary code overlay, percentage labels (38.67%), and speech-bubble data tags showing values like 812 and 814. Layered grid and glowing horizon line creating futuristic trading interface mood, supporting fintech and trading themes. High-tech color palette using deep blue and neon accents, enhancing sense of data flow and digital analytics. Serving as hero banner background, presentation backdrop, fintech advertising asset, app UI mockup, investor report header, market analysis article illustration, social media post visual, explainer video opener, or training material slide. Pairing with bold typography and data-driven layouts for corporate branding, SaaS landing pages, or financial newsletters. Recommending overlaying concise headlines and clear call-to-action elements for marketing use.
Powered by 


0
downloads
downloads
Tags:
More
Credit Photo
If you would like to credit the Photo, here are some ways you can do so
Text Link
photo Link
<span class="text-link">
<span>
<a target="_blank" href=https://pikwizard.com/photo/neon-finance-dashboard-displaying-live-market-charts-with-interactive-data-bubbles/9d18478347fb744e0b029826c6a1b75c/>PikWizard</a>
</span>
</span>
<span class="image-link">
<span
style="margin: 0 0 20px 0; display: inline-block; vertical-align: middle; width: 100%;"
>
<a
target="_blank"
href="https://pikwizard.com/photo/neon-finance-dashboard-displaying-live-market-charts-with-interactive-data-bubbles/9d18478347fb744e0b029826c6a1b75c/"
style="text-decoration: none; font-size: 10px; margin: 0;"
>
<img src="https://pikwizard.com/pw/medium/9d18478347fb744e0b029826c6a1b75c.jpg" style="margin: 0; width: 100%;" alt="" />
<p style="font-size: 12px; margin: 0;">PikWizard</p>
</a>
</span>
</span>
Free (free of charge)
Free for personal and commercial use.
Author: Authentic Images
Similar Free Stock Images

Premium


Premium


Premium


Premium


Premium


Premium


Premium


Premium


Premium


Premium


Premium


Premium


Premium


Premium


Premium


Premium


Premium


Premium


Premium


Premium


Premium


Premium


Premium


Premium