
- Home >
- Stock Photos >
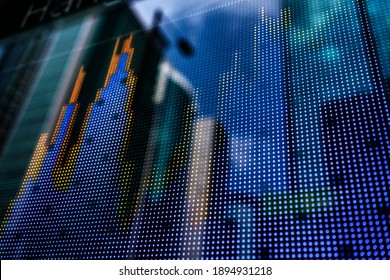
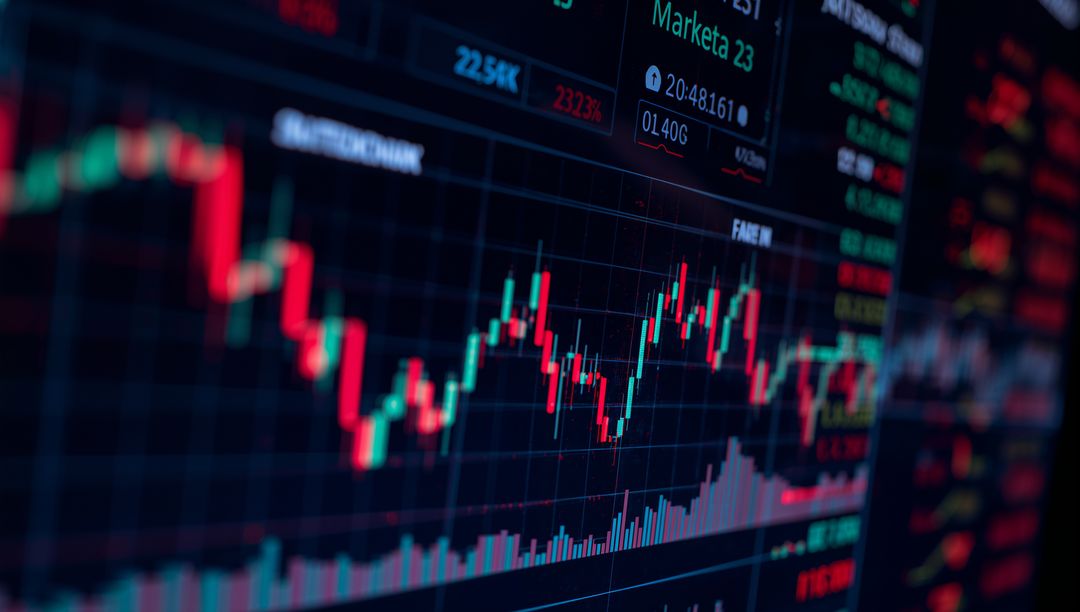
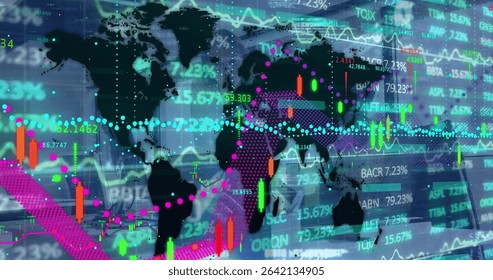
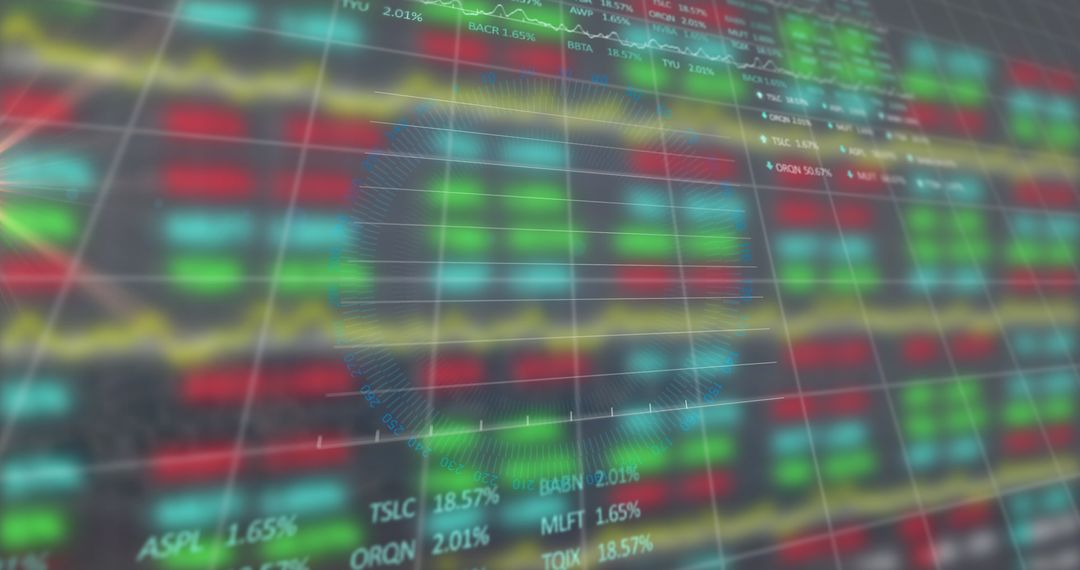
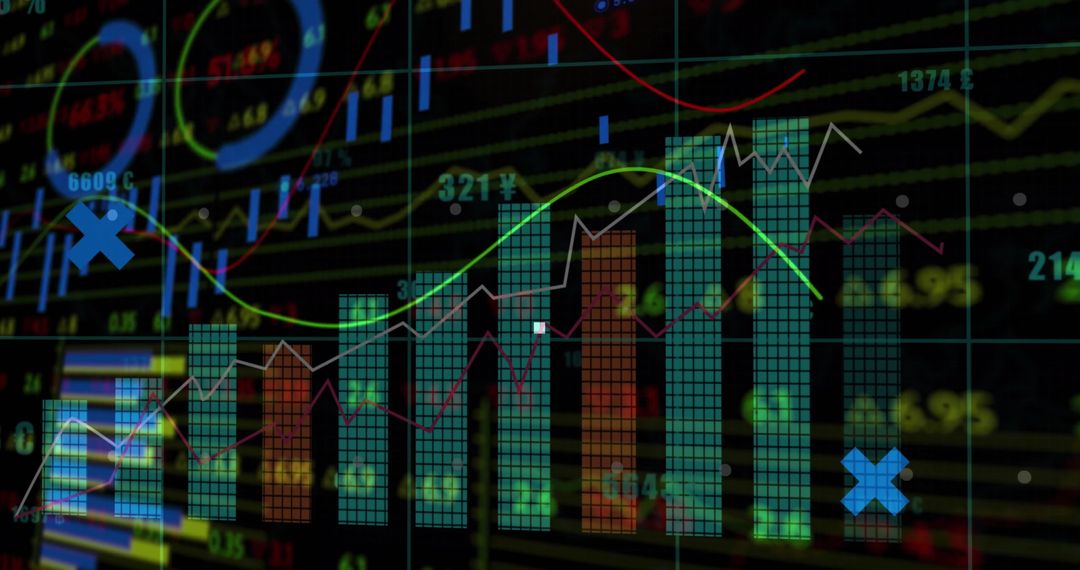
- Neon Finance Graphs Display on Trading Screen
Neon Finance Graphs Display on Trading Screen Image

AI Generated Image. Glowing neon financial line graphs on a flat-panel monitor provide a vibrant depiction of stock market data. This image is ideal for illustrating modern trading environments and data analysis concepts used in technology and finance articles, blog posts, or presentations focused on economic trends. It showcases the interplay between technology and market analytics in a dynamic display that emphasizes digital innovation.
Powered by  - Get 15% off with code: PIKWIZARD15


0
downloads
downloads
Tags:
More
Credit Photo
If you would like to credit the Photo, here are some ways you can do so
Text Link
photo Link
<span class="text-link">
<span>
<a target="_blank" href=https://pikwizard.com/photo/neon-finance-graphs-display-on-trading-screen/a4a5ec433a6a731ce15f1af903b3450a/>PikWizard</a>
</span>
</span>
<span class="image-link">
<span
style="margin: 0 0 20px 0; display: inline-block; vertical-align: middle; width: 100%;"
>
<a
target="_blank"
href="https://pikwizard.com/photo/neon-finance-graphs-display-on-trading-screen/a4a5ec433a6a731ce15f1af903b3450a/"
style="text-decoration: none; font-size: 10px; margin: 0;"
>
<img src="https://pikwizard.com/pw/medium/a4a5ec433a6a731ce15f1af903b3450a.jpg" style="margin: 0; width: 100%;" alt="" />
<p style="font-size: 12px; margin: 0;">PikWizard</p>
</a>
</span>
</span>
Free (free of charge)
Free for personal and commercial use.
Author: AI Creator
Similar Free Stock Images

Premium


Premium


Premium


Premium


Premium


Premium


Premium


Premium


Premium


Premium


Premium


Premium


Premium


Premium


Premium


Premium


Premium


Premium


Premium


Premium


Premium


Premium


Premium


Premium

