
- Home >
- Stock Photos >
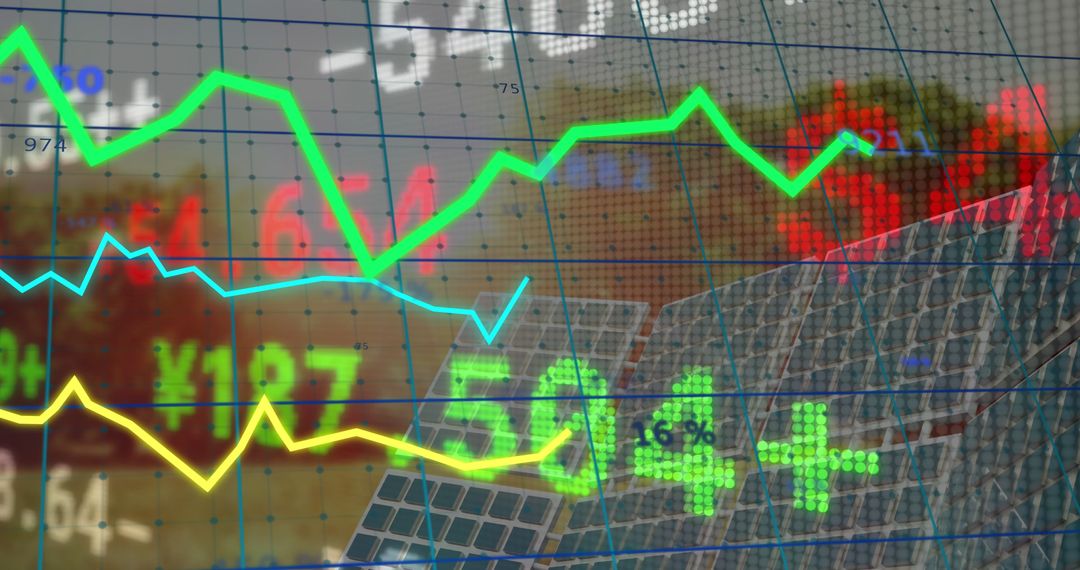
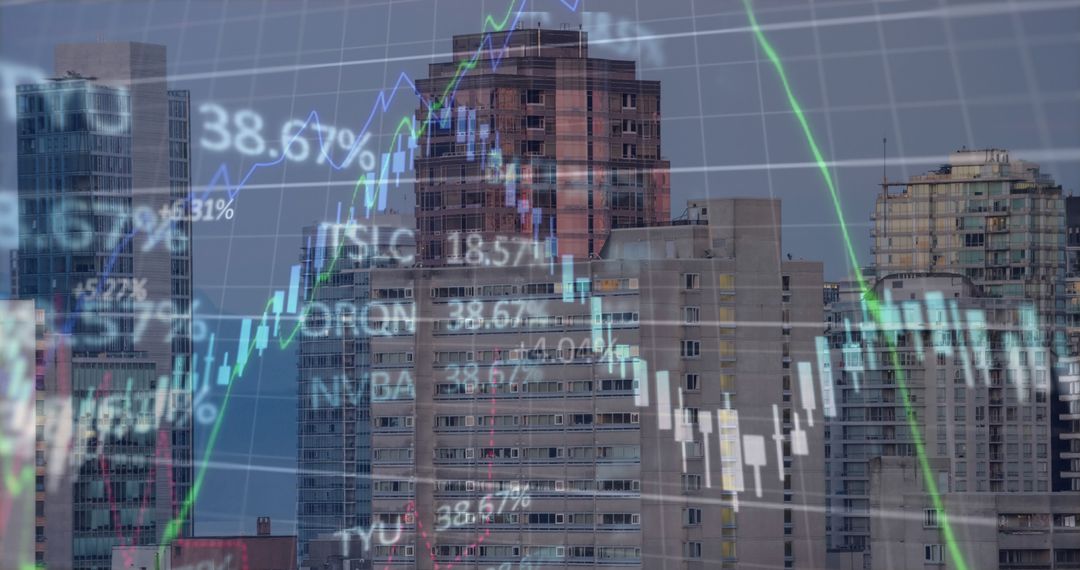
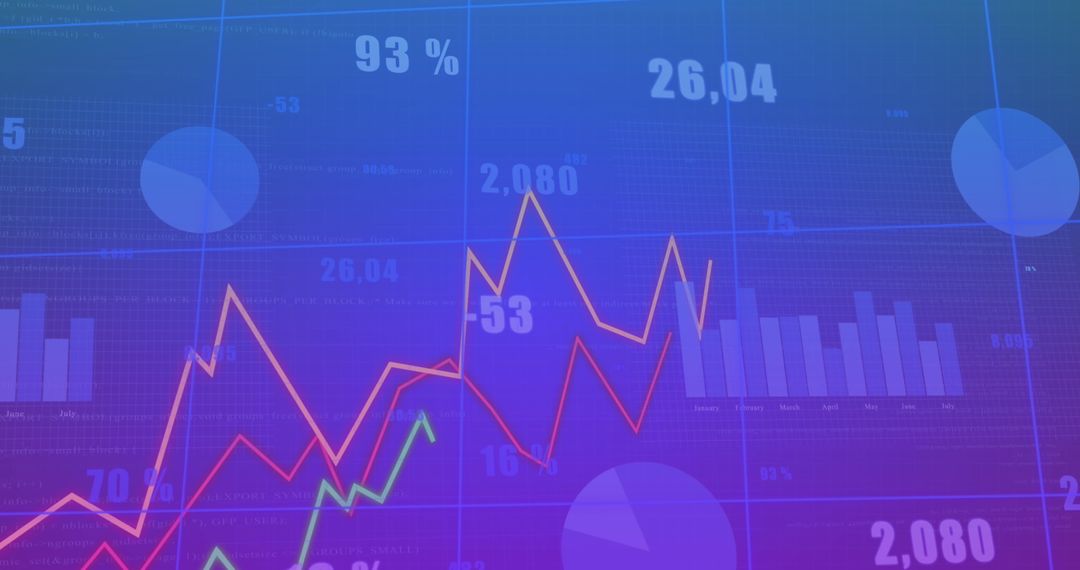
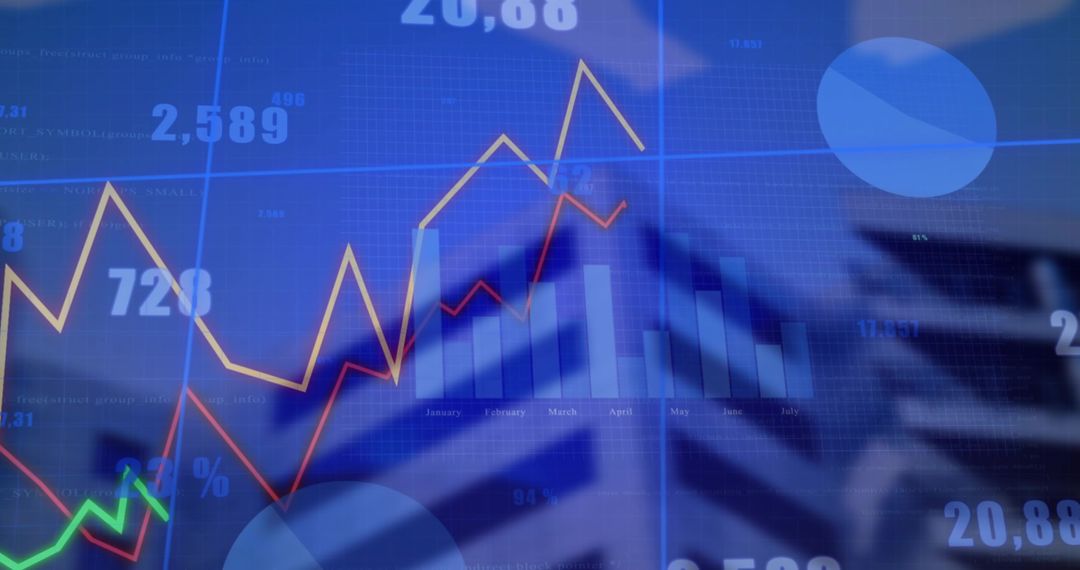
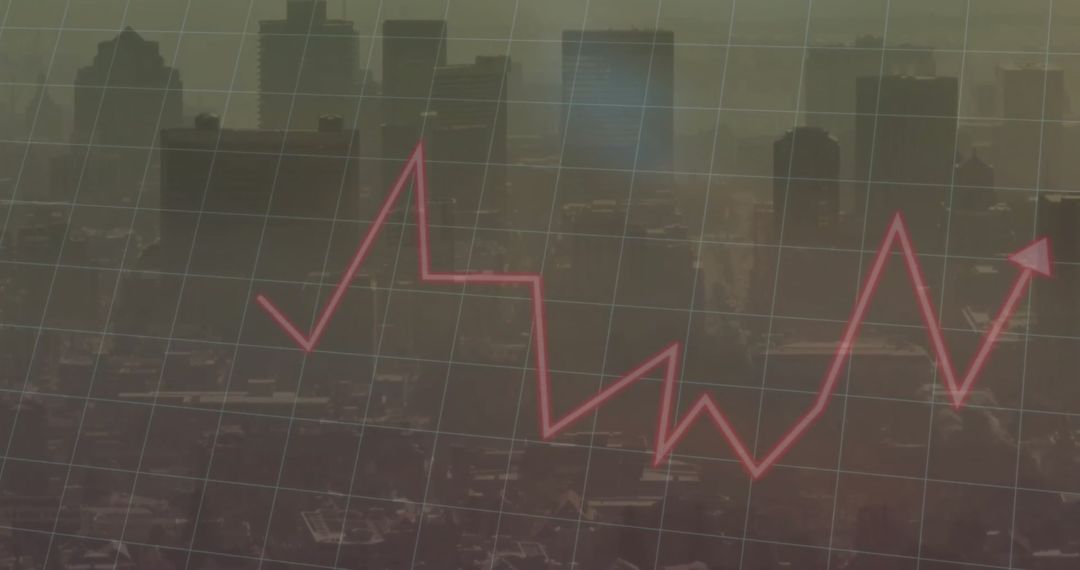
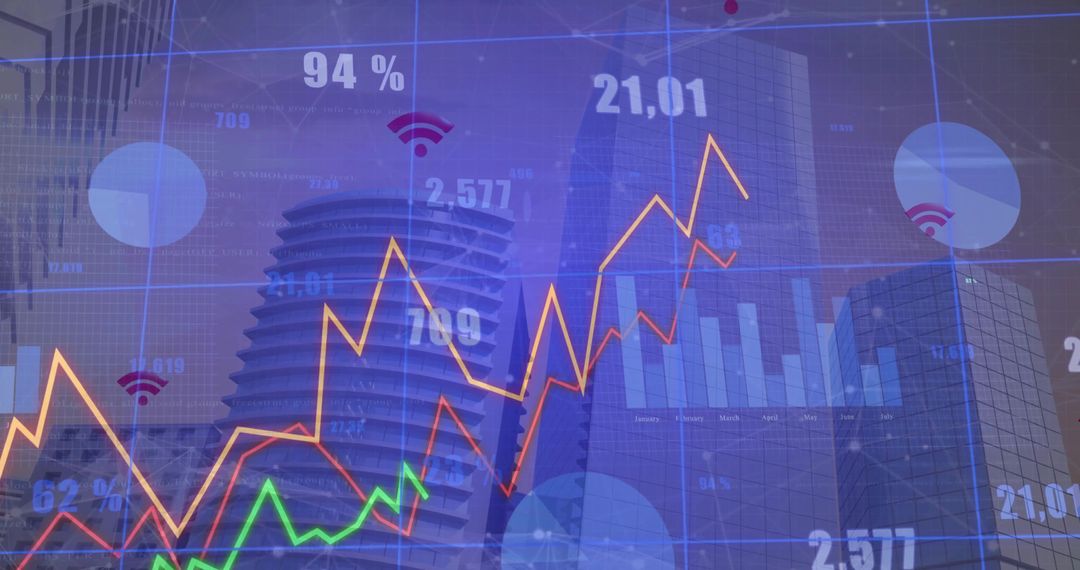
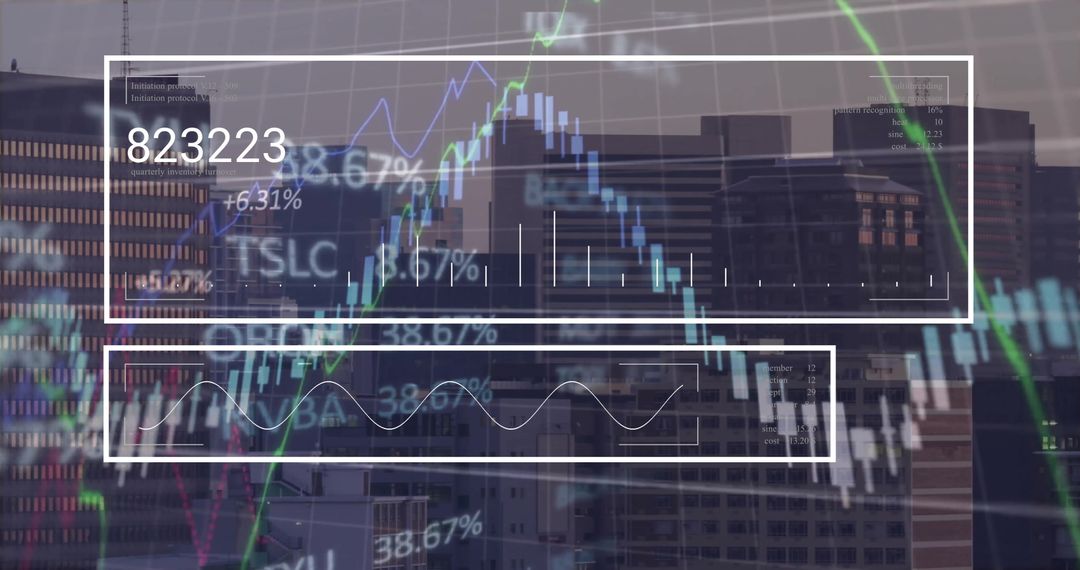
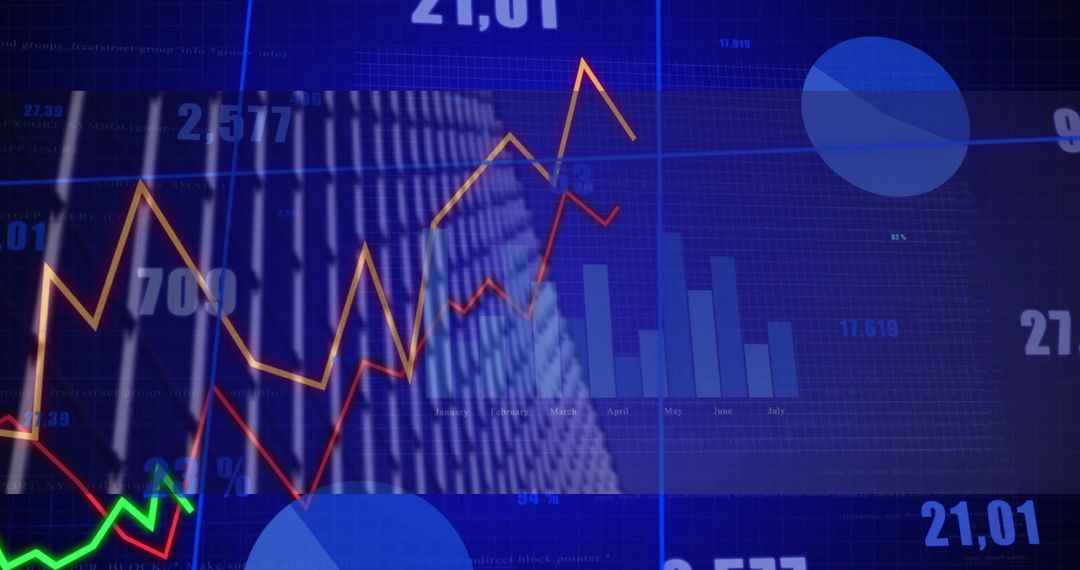
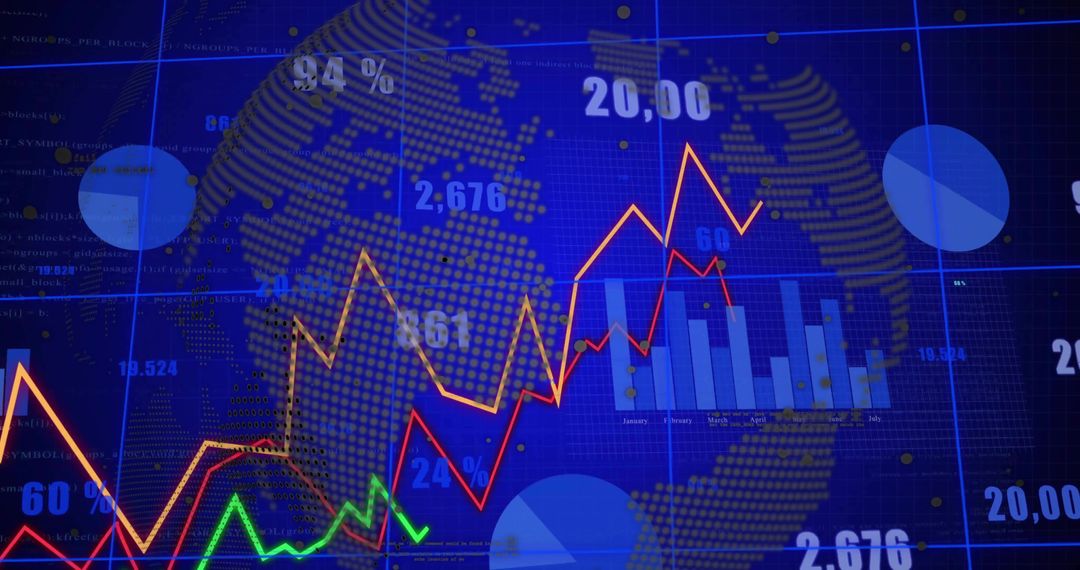
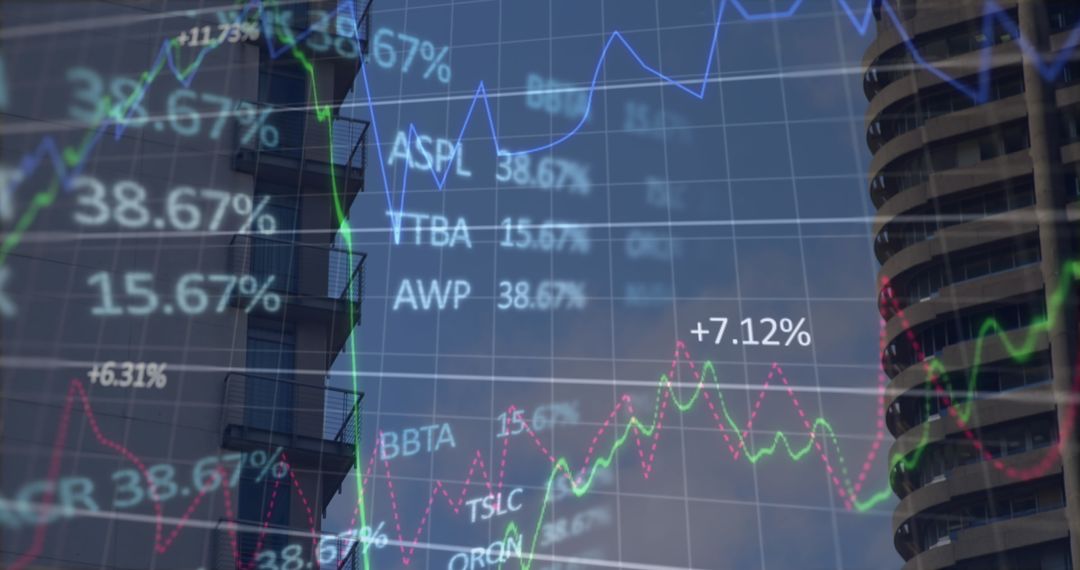
- Neon Financial Dashboard Overlay on Urban Glass Towers Showing Stock Trends and Analytics
Neon Financial Dashboard Overlay on Urban Glass Towers Showing Stock Trends and Analytics Image

Featuring neon-colored line graphs and bar charts overlaid on reflective glass towers, showing orange, red and green trend lines with percentage labels and numeric data points. Using deep blue and cyan palette with bright accent colors to convey high-tech finance and market activity. Ideal for illustrating market volatility, visualizing portfolio performance, communicating financial analytics, and showcasing trading or investment concepts. Suitable for enhancing website hero banners, annual reports, investor presentations, fintech landing pages, pitch decks, social media campaigns, and editorial layouts. Providing dramatic visual impact for corporate marketing, business blog posts, financial newsletters, and conference visuals. Offering flexible composition for overlaying text, headlines, or data callouts.
Powered by  - Get 15% off with code: PIKWIZARD15


0
downloads
downloads
Tags:
More
Credit Photo
If you would like to credit the Photo, here are some ways you can do so
Text Link
photo Link
<span class="text-link">
<span>
<a target="_blank" href=https://pikwizard.com/photo/neon-financial-dashboard-overlay-on-urban-glass-towers-showing-stock-trends-and-analytics/8e8a257de3acb70d0849aff3f1a5dcbe/>PikWizard</a>
</span>
</span>
<span class="image-link">
<span
style="margin: 0 0 20px 0; display: inline-block; vertical-align: middle; width: 100%;"
>
<a
target="_blank"
href="https://pikwizard.com/photo/neon-financial-dashboard-overlay-on-urban-glass-towers-showing-stock-trends-and-analytics/8e8a257de3acb70d0849aff3f1a5dcbe/"
style="text-decoration: none; font-size: 10px; margin: 0;"
>
<img src="https://pikwizard.com/pw/medium/8e8a257de3acb70d0849aff3f1a5dcbe.jpg" style="margin: 0; width: 100%;" alt="" />
<p style="font-size: 12px; margin: 0;">PikWizard</p>
</a>
</span>
</span>
Free (free of charge)
Free for personal and commercial use.
Author: Authentic Images
Similar Free Stock Images

Premium


Premium


Premium


Premium


Premium


Premium


Premium


Premium


Premium


Premium


Premium


Premium


Premium


Premium


Premium


Premium


Premium


Premium


Premium


Premium


Premium


Premium


Premium


Premium

