
- Home >
- Stock Photos >
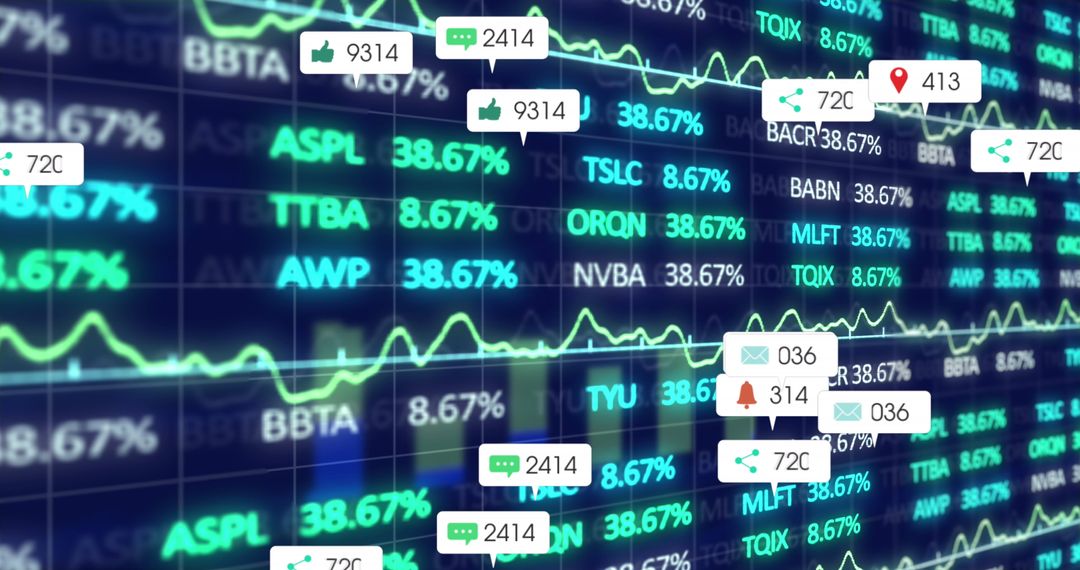
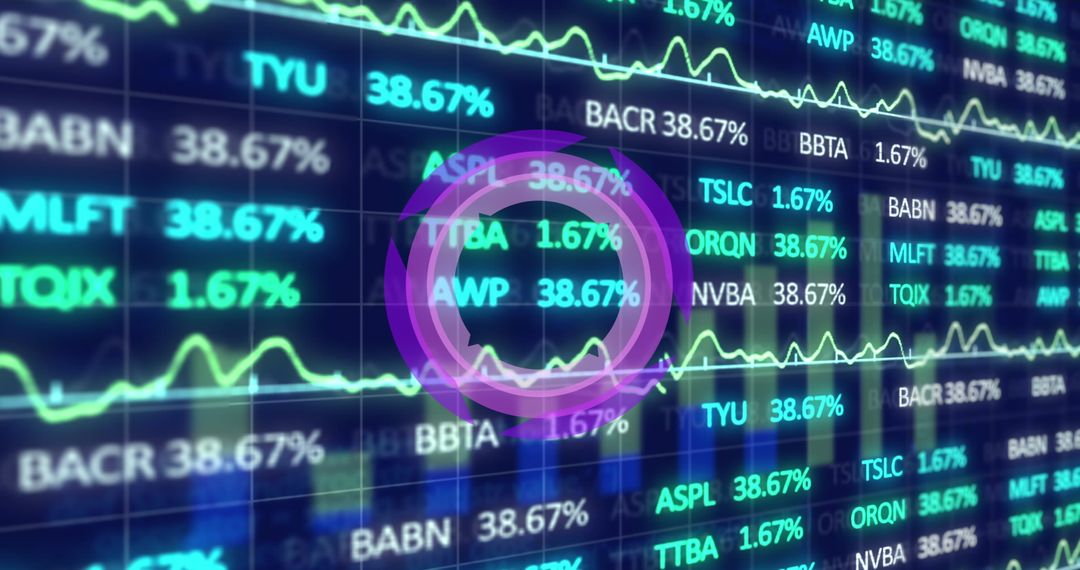
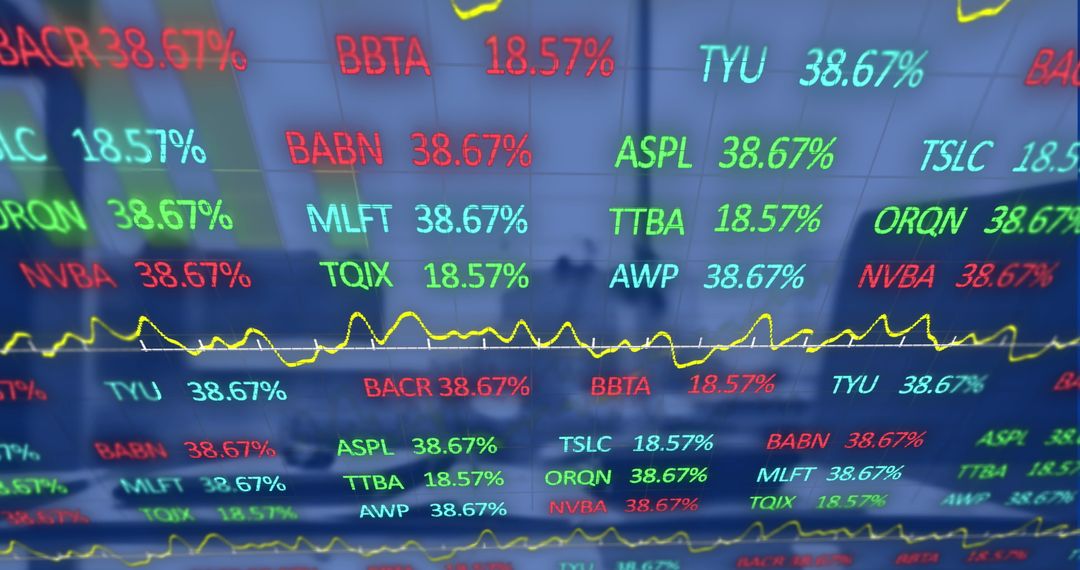
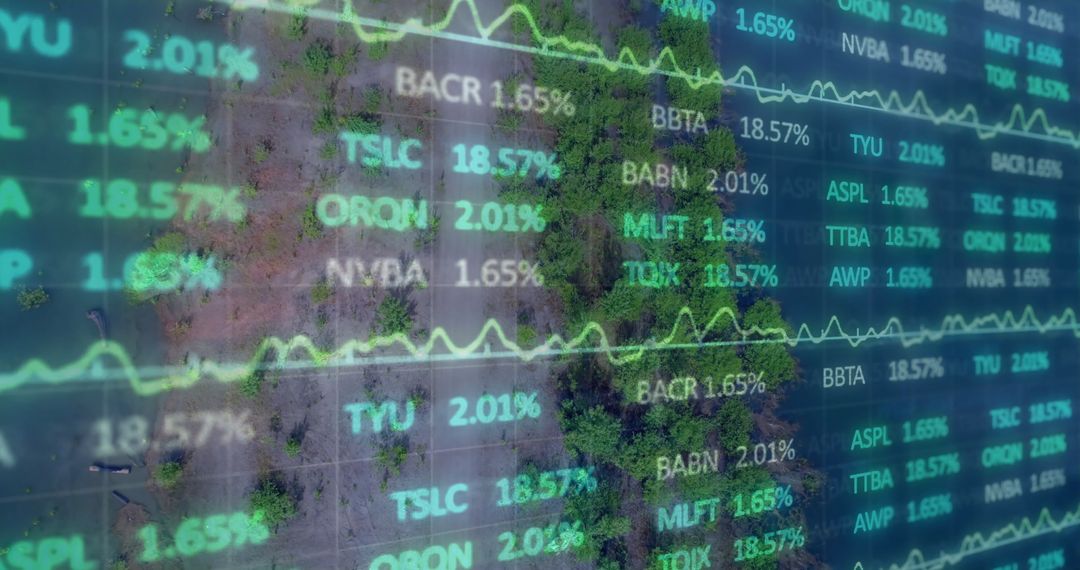
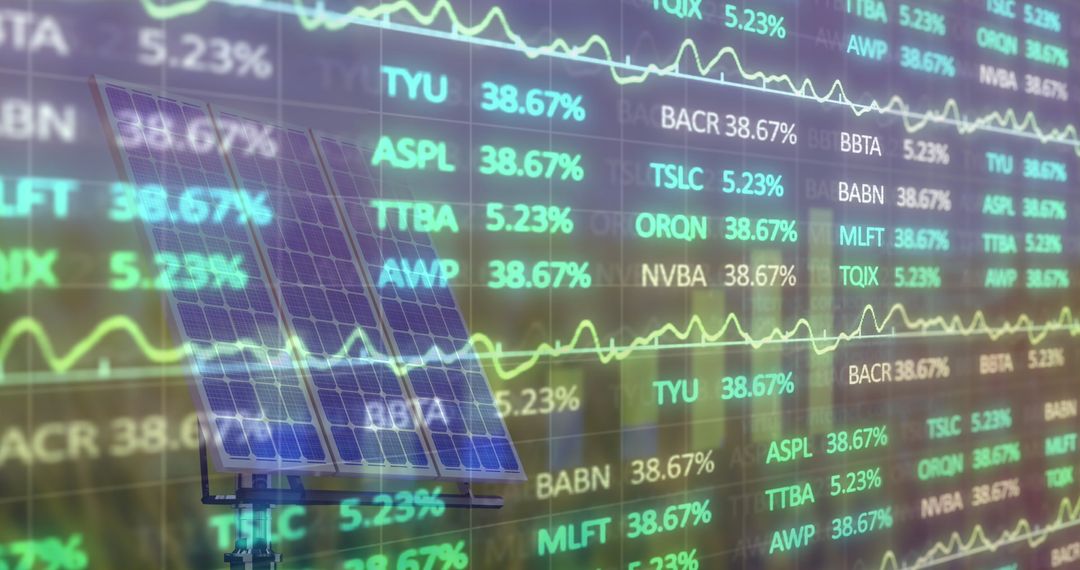
- Neon Financial Dashboard Showing Digital Stock Tickers, Percent Changes and Line Charts
Neon Financial Dashboard Showing Digital Stock Tickers, Percent Changes and Line Charts Image

Showing layered neon stock tickers, percent values, and dynamic line charts across grid layout. Featuring translucent bar graphics and fluctuating trendlines for high-energy market visualization. Using cool blue and green tones to convey technology-driven financial data. Suiting fintech, investment, trading, analytics, and financial news projects. Working well for website headers, app dashboards, investor presentations, pitch decks, social posts, and printed reports. Allowing designers to overlay headlines, data callouts, and UI components while preserving clear numeric information. Helping communicate market performance, portfolio updates, algorithmic trading, and trading-platform branding.
Powered by  - Get 15% off with code: PIKWIZARD15


0
downloads
downloads
Tags:
More
Credit Photo
If you would like to credit the Photo, here are some ways you can do so
Text Link
photo Link
<span class="text-link">
<span>
<a target="_blank" href=https://pikwizard.com/photo/neon-financial-dashboard-showing-digital-stock-tickers-percent-changes-and-line-charts/c090988bd8e5110a7aad1d6231c94052/>PikWizard</a>
</span>
</span>
<span class="image-link">
<span
style="margin: 0 0 20px 0; display: inline-block; vertical-align: middle; width: 100%;"
>
<a
target="_blank"
href="https://pikwizard.com/photo/neon-financial-dashboard-showing-digital-stock-tickers-percent-changes-and-line-charts/c090988bd8e5110a7aad1d6231c94052/"
style="text-decoration: none; font-size: 10px; margin: 0;"
>
<img src="https://pikwizard.com/pw/medium/c090988bd8e5110a7aad1d6231c94052.jpg" style="margin: 0; width: 100%;" alt="" />
<p style="font-size: 12px; margin: 0;">PikWizard</p>
</a>
</span>
</span>
Free (free of charge)
Free for personal and commercial use.
Author: Authentic Images
Similar Free Stock Images

Premium


Premium


Premium


Premium


Premium


Premium


Premium


Premium


Premium


Premium


Premium


Premium


Premium


Premium


Premium


Premium


Premium


Premium


Premium


Premium


Premium


Premium


Premium


Premium

