
- Home >
- Stock Photos >
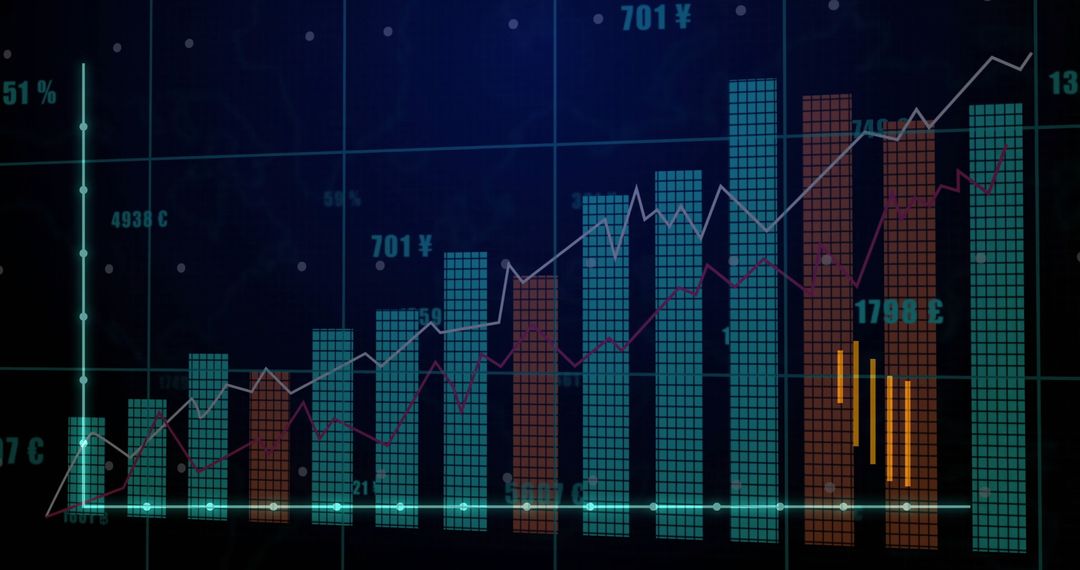
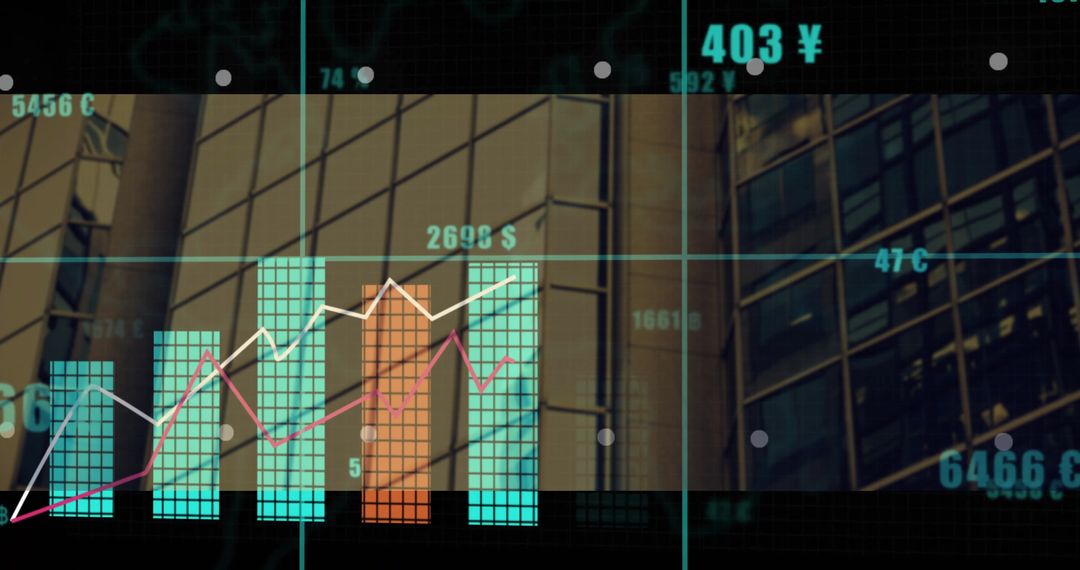
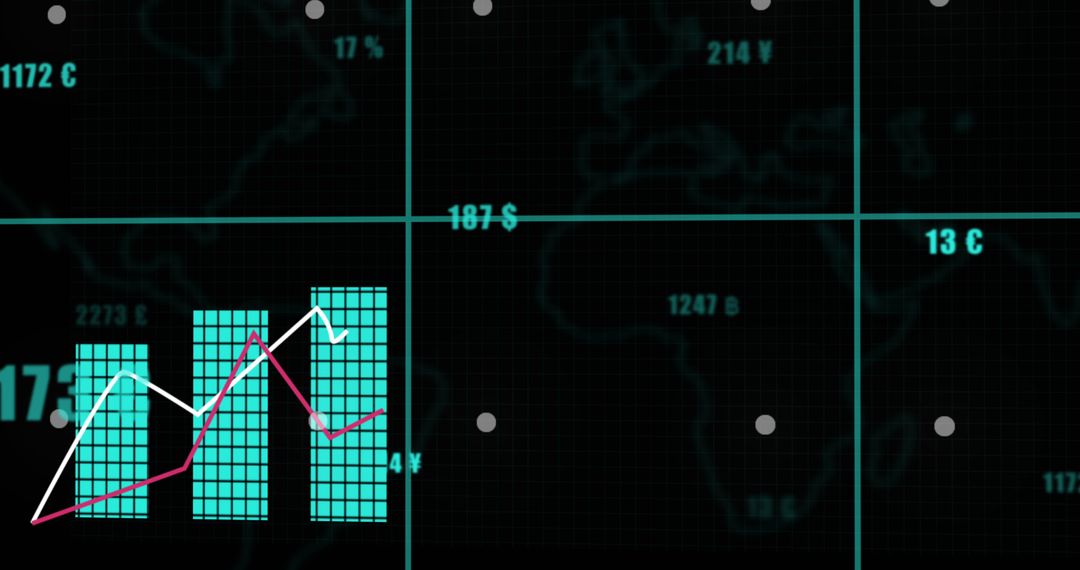
- Neon Financial Dashboard Showing Tiled Bar Chart and Trend Lines on Dark Grid Interface
Neon Financial Dashboard Showing Tiled Bar Chart and Trend Lines on Dark Grid Interface Image

Displaying teal and orange tiled bar chart on dark grid interface with overlaid white and magenta trend lines and scattered currency labels. Featuring neon green perspective lines and subtle numeric callouts for futuristic data dashboard feel. Combining bold color contrast with minimalistic grid layout for clear metric comparison and trend analysis. Ideal for financial presentations, investor pitch decks, fintech websites, app dashboards, marketing materials, editorial illustrations, social media posts. Use as hero background for analytics landing pages, slide visuals for revenue reports, header graphic for trading platforms, or decorative element for tech blog articles. Including space for custom overlays, text, or logo placement to adapt for branding and editorial needs.
Powered by  - Get 15% off with code: PIKWIZARD15


0
downloads
downloads
Tags:
More
Credit Photo
If you would like to credit the Photo, here are some ways you can do so
Text Link
photo Link
<span class="text-link">
<span>
<a target="_blank" href=https://pikwizard.com/photo/neon-financial-dashboard-showing-tiled-bar-chart-and-trend-lines-on-dark-grid-interface/b63b41e68603ca433e37b16cd746ce68/>PikWizard</a>
</span>
</span>
<span class="image-link">
<span
style="margin: 0 0 20px 0; display: inline-block; vertical-align: middle; width: 100%;"
>
<a
target="_blank"
href="https://pikwizard.com/photo/neon-financial-dashboard-showing-tiled-bar-chart-and-trend-lines-on-dark-grid-interface/b63b41e68603ca433e37b16cd746ce68/"
style="text-decoration: none; font-size: 10px; margin: 0;"
>
<img src="https://pikwizard.com/pw/medium/b63b41e68603ca433e37b16cd746ce68.jpg" style="margin: 0; width: 100%;" alt="" />
<p style="font-size: 12px; margin: 0;">PikWizard</p>
</a>
</span>
</span>
Free (free of charge)
Free for personal and commercial use.
Author: Awesome Content
Similar Free Stock Images

Premium


Premium


Premium


Premium


Premium


Premium


Premium


Premium


Premium


Premium


Premium


Premium


Premium


Premium


Premium


Premium


Premium


Premium


Premium


Premium


Premium


Premium


Premium


Premium

