- Home >
- Stock Photos >
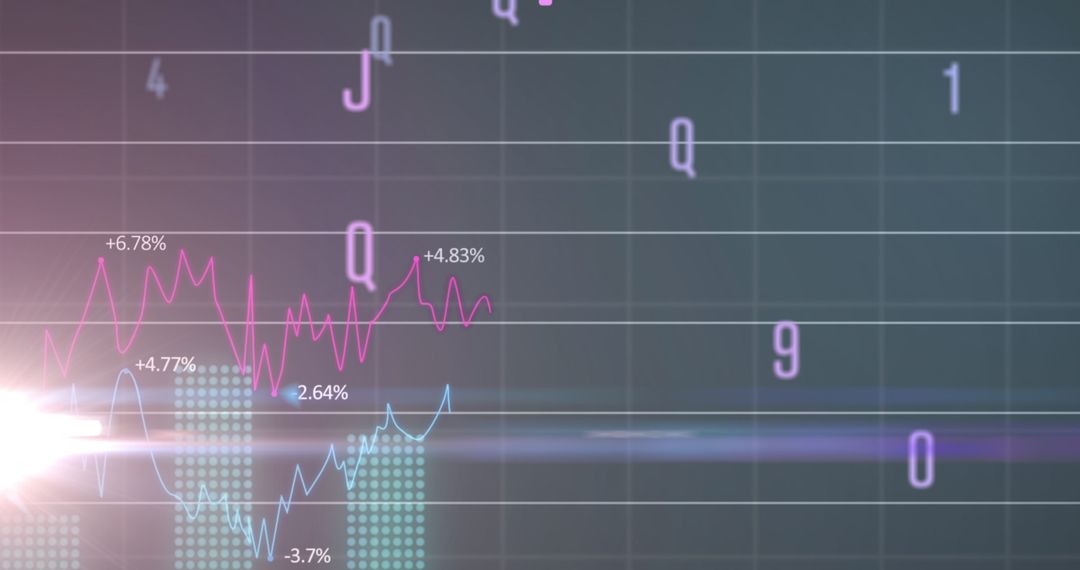
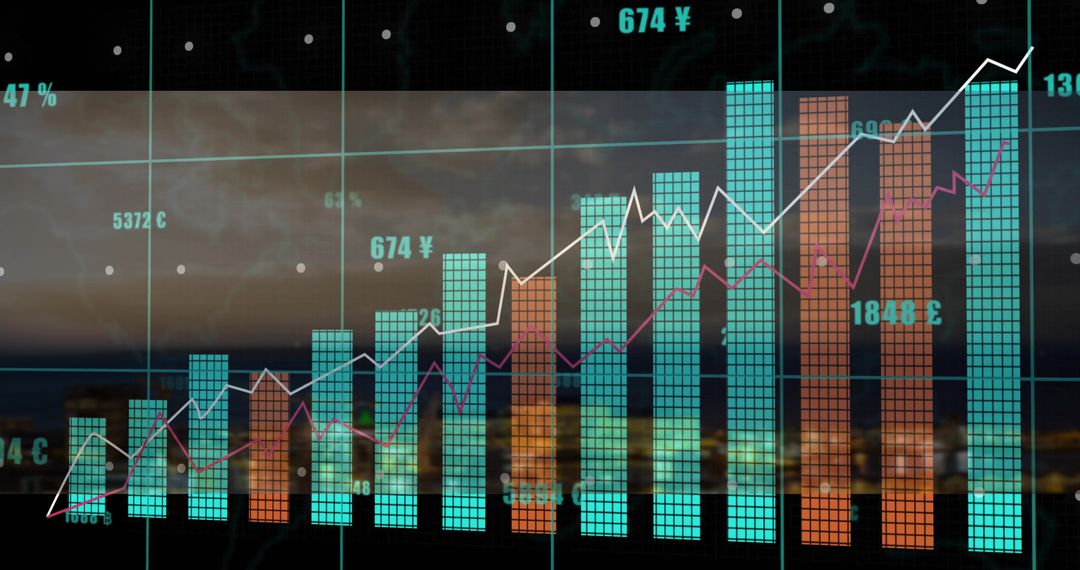
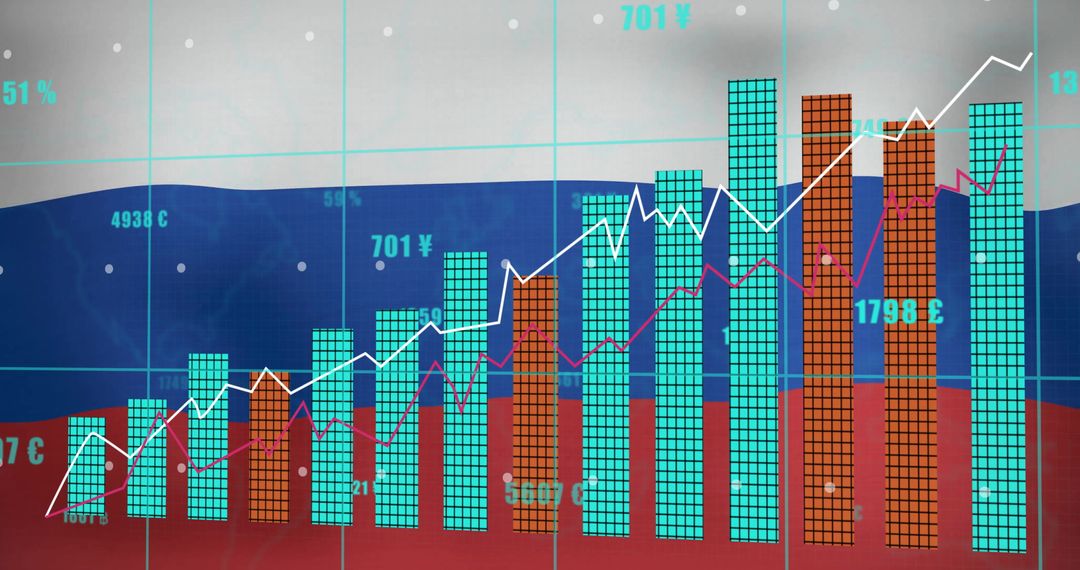
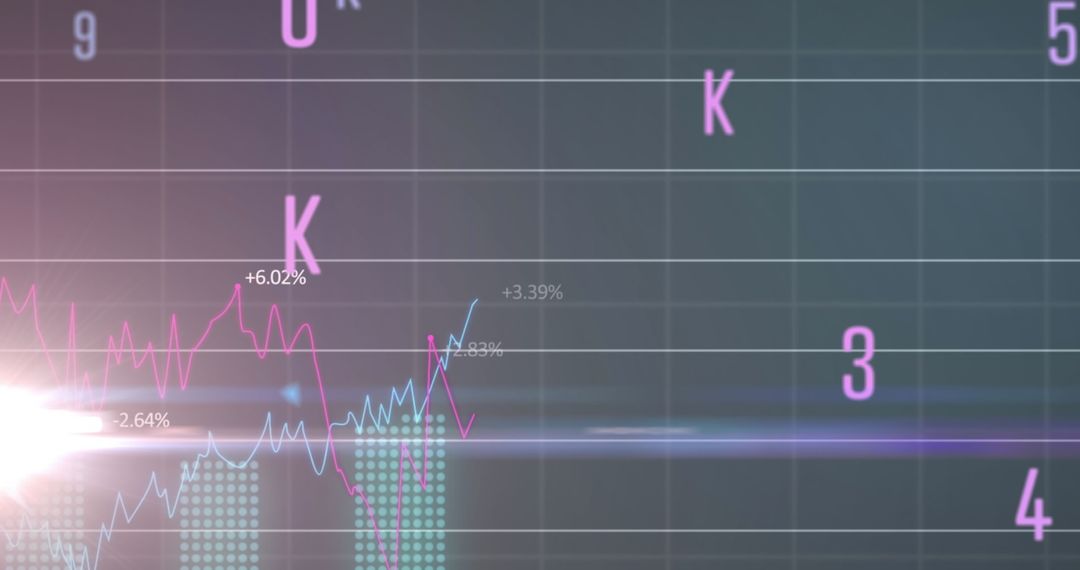
- Neon Financial Dashboard with Bar and Line Charts Showing Currency Trends and Growth
Neon Financial Dashboard with Bar and Line Charts Showing Currency Trends and Growth Image

Neon financial dashboard displaying cyan bar chart with one highlighted red bar, two overlaid trend lines, grid overlay and currency labels (¥, £, €). Digital glow and lens flare creating futuristic, high-tech atmosphere. Illustrating upward trends and short-term volatility while emphasizing comparative performance across currencies. Working well for fintech website headers, market analysis articles, investor pitch decks, financial reports, trading platform UI mockups, webinar slides, social media posts about economy and investment, and video overlays for stock market updates. Wide horizontal composition fitting web banners and hero sections. Color palette and contrast allowing easy text overlays and infographic annotation.
Powered by  - Get 15% off with code: PIKWIZARD15


0
downloads
downloads
Tags:
More
Credit Photo
If you would like to credit the Photo, here are some ways you can do so
Text Link
photo Link
<span class="text-link">
<span>
<a target="_blank" href=https://pikwizard.com/photo/neon-financial-dashboard-with-bar-and-line-charts-showing-currency-trends-and-growth/a1eeb16c7781c998b7c24d2a708c39c0/>PikWizard</a>
</span>
</span>
<span class="image-link">
<span
style="margin: 0 0 20px 0; display: inline-block; vertical-align: middle; width: 100%;"
>
<a
target="_blank"
href="https://pikwizard.com/photo/neon-financial-dashboard-with-bar-and-line-charts-showing-currency-trends-and-growth/a1eeb16c7781c998b7c24d2a708c39c0/"
style="text-decoration: none; font-size: 10px; margin: 0;"
>
<img src="https://pikwizard.com/pw/medium/a1eeb16c7781c998b7c24d2a708c39c0.jpg" style="margin: 0; width: 100%;" alt="" />
<p style="font-size: 12px; margin: 0;">PikWizard</p>
</a>
</span>
</span>
Free (free of charge)
Free for personal and commercial use.
Author: Authentic Images
Similar Free Stock Images
Premium


Premium


Premium


Premium


Premium


Premium


Premium


Premium


Premium


Premium


Premium


Premium


Premium


Premium


Premium


Premium


Premium


Premium


Premium


Premium


Premium


Premium


Premium


Premium