- Home >
- Stock Photos >
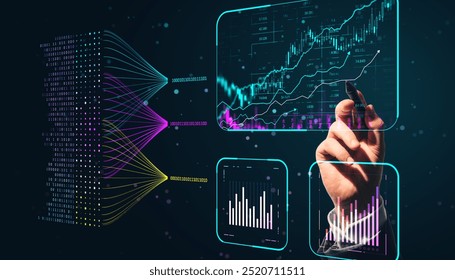
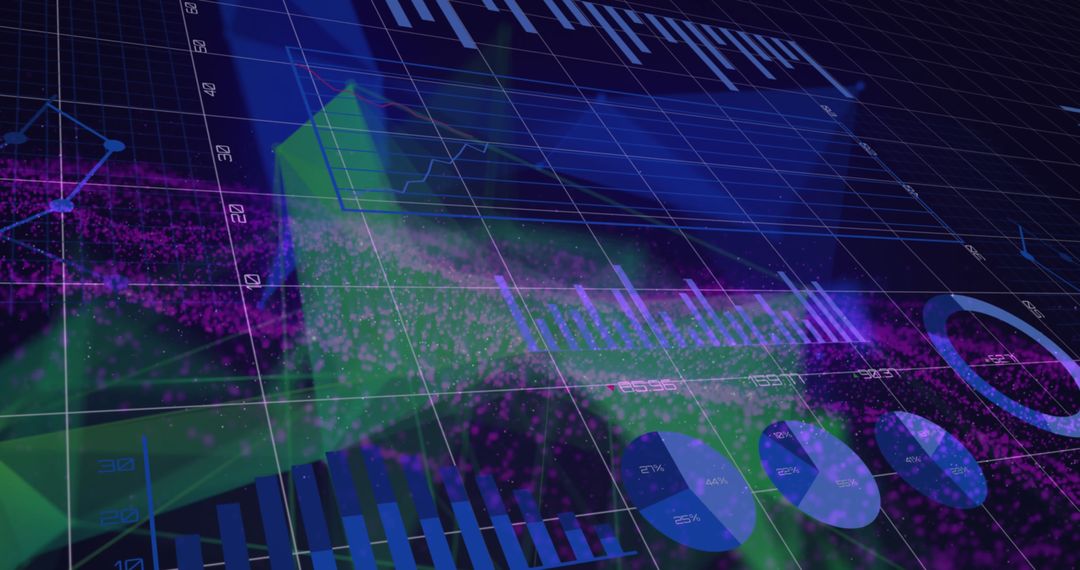
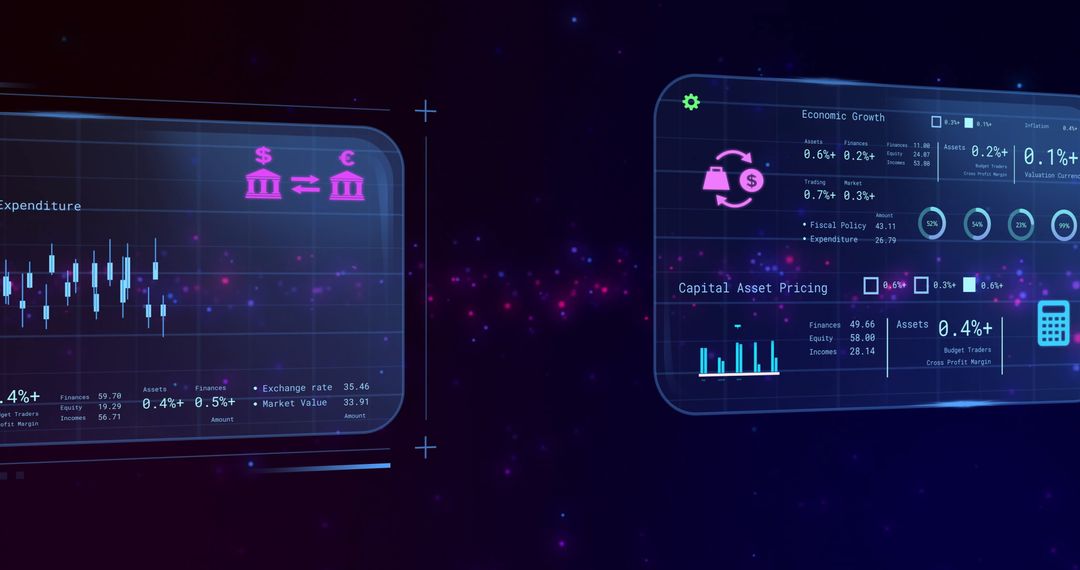
- Neon Financial Dashboard with Innovative Data Visualization
Neon Financial Dashboard with Innovative Data Visualization Image

AI Generated Image. This image showcases a cutting-edge financial dashboard with vibrant neon colors and abstract data visualization. It includes pink bar charts and green line graphs, conveying technology and innovation. Suitable for use in fintech promotions, tech blogs, or digital analytics showcases highlighting advanced data solutions and futuristic themes.
Powered by  - Get 15% off with code: PIKWIZARD15


0
downloads
downloads
Tags:
More
Credit Photo
If you would like to credit the Photo, here are some ways you can do so
Text Link
photo Link
<span class="text-link">
<span>
<a target="_blank" href=https://pikwizard.com/photo/neon-financial-dashboard-with-innovative-data-visualization/d47e502e11f343420253d9e15a172903/>PikWizard</a>
</span>
</span>
<span class="image-link">
<span
style="margin: 0 0 20px 0; display: inline-block; vertical-align: middle; width: 100%;"
>
<a
target="_blank"
href="https://pikwizard.com/photo/neon-financial-dashboard-with-innovative-data-visualization/d47e502e11f343420253d9e15a172903/"
style="text-decoration: none; font-size: 10px; margin: 0;"
>
<img src="https://pikwizard.com/pw/medium/d47e502e11f343420253d9e15a172903.jpg" style="margin: 0; width: 100%;" alt="" />
<p style="font-size: 12px; margin: 0;">PikWizard</p>
</a>
</span>
</span>
Free (free of charge)
Free for personal and commercial use.
Author: AI Creator
Similar Free Stock Images

Premium


Premium


Premium


Premium


Premium


Premium


Premium


Premium


Premium


Premium


Premium


Premium


Premium


Premium


Premium


Premium


Premium


Premium


Premium


Premium


Premium


Premium


Premium


Premium