
- Home >
- Stock Photos >
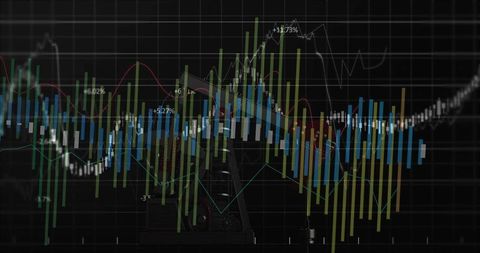
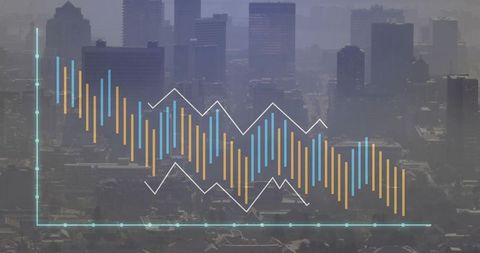
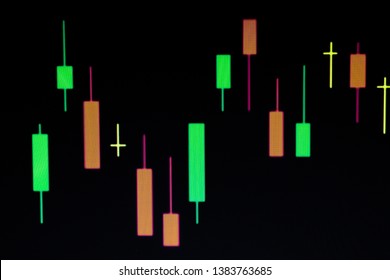
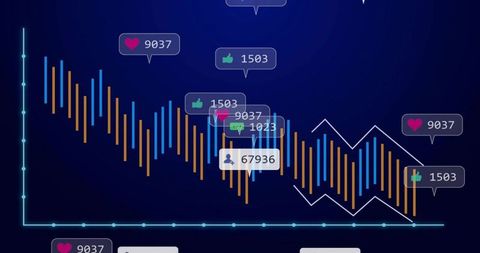
- Neon Financial Data Visualization with Multicolored Candlestick Bars and Trend Lines
Neon Financial Data Visualization with Multicolored Candlestick Bars and Trend Lines Image

Depicting neon candlestick bars, multicolored histogram bars, and flowing red and teal trend lines over dark gradient background. Featuring glowing rectangular frames and subtle waveform elements to evoke futuristic analytics and digital trading environment. Suiting fintech websites, trading platform interfaces, investor presentations, annual reports, and marketing campaigns. Working well for hero banners, slide decks, app mockups, social media posts, and video thumbnails. Allowing easy overlay of text, charts, and UI components thanks to clear central composition and high contrast. Providing visual metaphor for market volatility, momentum, algorithmic trading, and data-driven storytelling. Color palette and negative space enabling custom branding and template reuse.
Powered by  - Get 15% off with code: PIKWIZARD15


downloads
Tags:
More
Credit Photo
If you would like to credit the Photo, here are some ways you can do so
Text Link
photo Link
<span class="text-link">
<span>
<a target="_blank" href=https://pikwizard.com/photo/neon-financial-data-visualization-with-multicolored-candlestick-bars-and-trend-lines/09cf13f368caaacce6dd57b84e1fefa7/>PikWizard</a>
</span>
</span>
<span class="image-link">
<span
style="margin: 0 0 20px 0; display: inline-block; vertical-align: middle; width: 100%;"
>
<a
target="_blank"
href="https://pikwizard.com/photo/neon-financial-data-visualization-with-multicolored-candlestick-bars-and-trend-lines/09cf13f368caaacce6dd57b84e1fefa7/"
style="text-decoration: none; font-size: 10px; margin: 0;"
>
<img src="https://pikwizard.com/pw/medium/09cf13f368caaacce6dd57b84e1fefa7.jpg" style="margin: 0; width: 100%;" alt="" />
<p style="font-size: 12px; margin: 0;">PikWizard</p>
</a>
</span>
</span>
Free (free of charge)
Free for personal and commercial use.
Author: Awesome Content
Similar Free Stock Images
Premium


Premium


Premium


Premium


Premium


Premium

Premium

Premium


AI

Premium

Premium


Premium


Premium


Premium


Premium


Premium


Premium


Premium


Premium


Premium


Premium

Premium


Premium


Premium

Premium


Premium


Explore More Free Stock Images