- Home >
- Stock Photos >
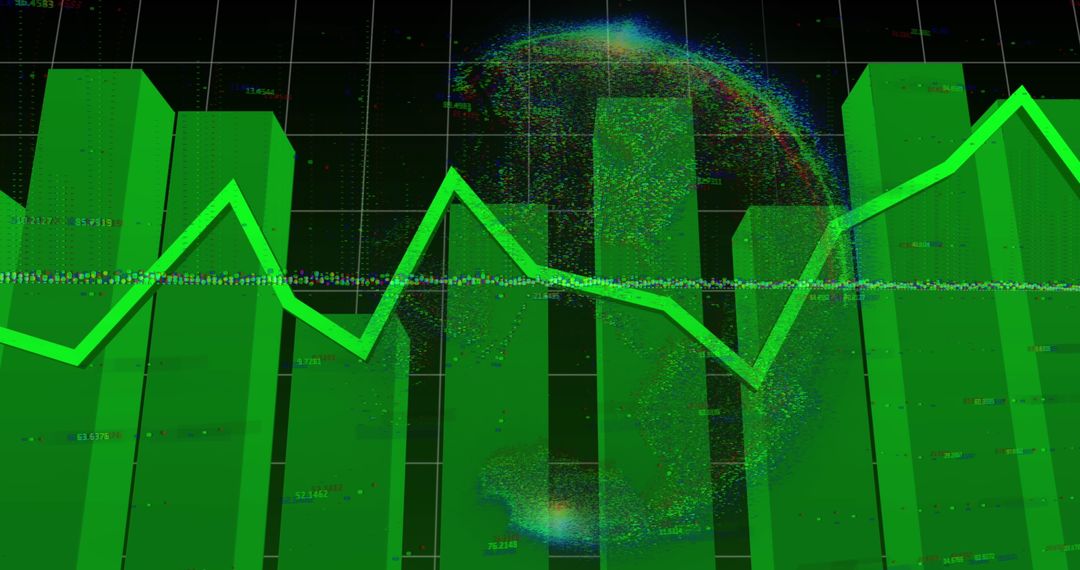
- Neon Frame Over 3D Graph on Blue Background
Neon Frame Over 3D Graph on Blue Background Image

Green neon rectangle placed over a digital 3D bar graph set against a blue grid background indicates advanced data processing and analysis. Useful for illustrating concepts related to technology, global data analytics, finance, digital trends, and computing innovation.
Powered by 


2
downloads
downloads
Tags:
More
Credit Photo
If you would like to credit the Photo, here are some ways you can do so
Text Link
photo Link
<span class="text-link">
<span>
<a target="_blank" href=https://pikwizard.com/photo/neon-frame-over-3d-graph-on-blue-background/1472bd1dba67aa8fd8ce9171042d0f9f/>PikWizard</a>
</span>
</span>
<span class="image-link">
<span
style="margin: 0 0 20px 0; display: inline-block; vertical-align: middle; width: 100%;"
>
<a
target="_blank"
href="https://pikwizard.com/photo/neon-frame-over-3d-graph-on-blue-background/1472bd1dba67aa8fd8ce9171042d0f9f/"
style="text-decoration: none; font-size: 10px; margin: 0;"
>
<img src="https://pikwizard.com/pw/medium/1472bd1dba67aa8fd8ce9171042d0f9f.jpg" style="margin: 0; width: 100%;" alt="" />
<p style="font-size: 12px; margin: 0;">PikWizard</p>
</a>
</span>
</span>
Free (free of charge)
Free for personal and commercial use.
Author: Awesome Content
Similar Free Stock Images