1. Home > 
  2. Stock Photos > 
  3. Neon Glitch Market Waveform Showing Volatile Financial Chart with Glowing Scanlines

Neon Glitch Market Waveform Showing Volatile Financial Chart with Glowing Scanlines Image

Neon Glitch Market Waveform Showing Volatile Financial Chart with Glowing Scanlines

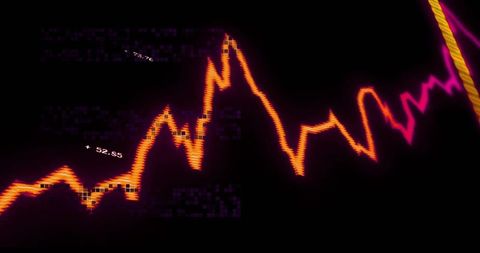
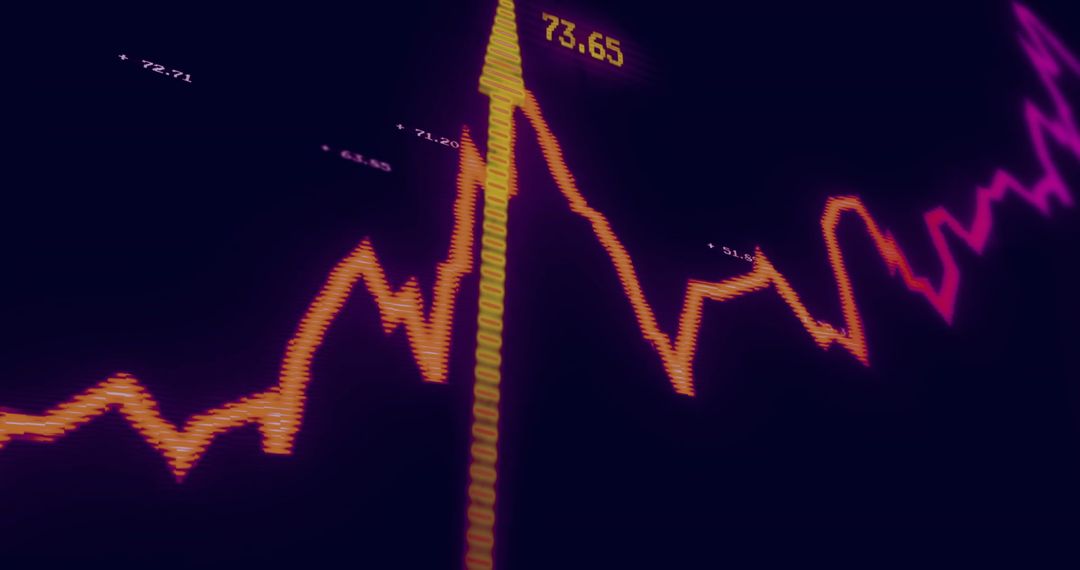
Showing neon jagged line moving across dark background with orange and magenta glow, purple scanlines and pixel noise, plus small numeric label +52.85 and yellow braided cord at right edge. Featuring sharp peaks and troughs suggesting market volatility, data spikes and glitchy digital readout. Conveying high-tech, cyberpunk mood ideal for finance and technology narratives. Serving as striking header or hero visual for trading platforms, fintech apps, analytics dashboards, market commentary, financial news, presentation slides and social media campaigns. Allowing headline text or logo overlay due to ample negative space; supporting animation for motion graphics, video intros and website hero loops. Enabling color grading and crop variations for web, print and broadcast use.

Powered by Adobe logo
Hand interacting with financial stock market trading candlestick charts analyzing growth opportunities and investment strategies - Powered by AdobeGlowing golden bar chart and upward trend line illustrating financial growth on a smartphone screen - Powered by AdobeGlobal financial market crash with downward arrow and graph on digital red grid background showing crisis and economic collapse impact concept. 3D Rendering - Powered by Adobestock market trend chart - Powered by AdobePowerful bull stands against backdrop of rising stock market charts, symbolizing financial growth and optimism - Powered by Adobe

Credit Photo

If you would like to credit the Photo, here are some ways you can do so

Free (free of charge)

Free for personal and commercial use.

Author: People Creations

Similar Free Stock Images

Dynamic Financial Data Graph in Digital Grid Display
Premium
abstract colorful bar graph showing business growth and financial success with data analysis and market trends for corporate presentation and website
Digital Financial Chart on Black Background with Neon Lines
Dynamic Financial Data Analytics Interface with Blue Background
Dynamic Stock Market Chart Showing Fluctuating Financial Data
Digital World Map with Dynamic Financial Analysis Overlay
Premium
Green arrow pointing upward on financial graph. Business growth chart with rising trend line. Digital stock market data visualization for investment analysis
Declining Stock Market Graph on Dotted Grid Background
Rising Financial Market Trends with Data Visualization
Abstract Financial Graphs Illuminating Stock Market Trends
Futuristic Stock Market Data Visualization with Graphs
Premium
Colorful glowing candlestick chart with trend lines on dark background showing financial and stock market data analytics concept.
Futuristic Stock Market Graph With Digital Overlay
Dynamic Global Market Trends Over World Map Visualization
Financial Data Analysis with Declining Trends
Dynamic Digital Soundwave Pattern on Dark Background
Premium
Soap bubble in front of stock market screen representing fragility of financial markets, economic speculation, risk, and market trend forecasting
Financial Data Analysis Vibrant Graphs on Blue Background
Binary Code Data Over Financial Graph with Red Trends
Dynamic Stock Market Graph with ECO Icons
Dynamic Stock Market Chart with Fluctuating Trends and Data Points
Premium
Red arrow graph, business stock market investment down fall direction loss stock market crash 2025, Down fall trend red arrow graph, Red arrow chart graph in downward direction, concept of stock marke
Dynamic Financial Data Visualization with Abstract Graph
Dynamic Candlestick and Histogram Chart for Financial Analytics
Stock Market Candlestick Chart Trading Analysis Display
Dynamic Financial Data Visuals on Futuristic Neon Interface
Premium
Green stock market candlestick chart showing upward trend and financial growth on a dark background
Rising Trend on Digital Financial Analytics Screen
Red Market Line Graph Showing Financial Fluctuations with Upward Arrows and Data Points
Neon Financial Market Chart Displaying Candlestick Trends and Dynamic Teal Bar Waveform
Candlestick trend with teal vertical bars on black background for market analysis
Abstract Financial Chart Technology Interface
Graph Lines Portraying Financial Data Trends
Premium
Hand holding a magnifying glass over a stock market chart- analyzing fluctuating trends and data for investment insights and financial growth.
Dynamic Digital Financial Data Interface Background
Financial Data Processing Visualization with Colorful Bar Charts
Colorful Digital Waveform Represents Global Connections
Abstract Financial Graph on Dark Digital Background
Premium
Analyzing financial growth charts for strategic business decisions and investment opportunities, envisioning success with data-driven insights and projections
Dynamic Financial Stock Market Data Analysis
Dynamic Green Stock Chart on Digital Grid Background
Colorful Data Chart Over Blue Background
Fluctuating Digital Stock Market Data Chart
Premium
Turkish flag overlayed on a financial stock market chart showing upward trends and economic growth
Digital Interface with Global Business Data Analytics
Financial Graphs Displaying Business Trends on Grid Background
Dynamic Colorful Waves on Black Digital Background
Financial Data Processing Visualization with Green Digital Grid
Premium
Screen with stock market index charts and diagrams
Financial Data Analytics with Dynamic Green Arrows
Glowing Financial Graph with World Map in Dark Background
Dynamic Financial Data Analysis with Graph Overlays
Digital Stock Market Graph Red Trendline on Green Background
Premium
Close up of a businessman s hand pointing at a glowing upward trending financial stock market graph on a digital tablet screen
Futuristic Analytics Graph with Cyan-Orange Line Trends
Dynamic Candlestick Chart on Black Background
Dynamic Line and Bar Graph on Digital Screen
Futuristic Data Dashboard with Colorful Line Graphs
Premium
Close up of a finger touching a digital financial stock market graph on a screen
Red Downtrend Line Falling Across Digital Financial Dashboard With Teal Indicator Dots
Neon Financial Chart Showing Jagged Orange Line and Yellow Marker Highlighting 73.65
Neon Candlestick Chart with Blue and Green Trend Lines and Percent Labels, Volatility
Dynamic Graph with Vibrant Lines on Black Background
Dynamic Financial Market Trends with Data Visualizations
Abstract Digital Financial Chart on Blue Background
Premium
Stock market downturn with red candlestick chart, declining line graphs, and trading data screen. Ideal for illustrating financial loss, recession, risk, and economic decline in business visuals.
Financial Data Overlay on Cityscape Visualizing Market Trends
Abstract Sound Waves on Dark Background
Abstract Financial Graph with Bar and Line Charts on Dark Background
Declining Stock Market Graph on Digital Background
Premium
A glowing red arrow pointing upwards over a stock chart with a dark blue and purple bokeh background
Dynamic Stock Market Data Visualization on Digital Interface Background
Dynamic Financial Growth Representing Business Trends
Dynamic Financial Graph on Digital Background
Dynamic Stock Market Data on Digital Interface
Premium
Green graph line rising on bar chart. Stock market price growth, financial profit success in investment business.
Abstract Stock Market Data with Growing Graph
Financial Data Processing with Rising Graphs
Dynamic Financial Stock Market Graph
Glowing Financial Graph of Stock Market Trends on Digital Screen
Premium
City skyline with stock market graph reflected on building at sunset
Dynamic Financial Data Displays Stock Market Trends
Fluctuating Stock Market Graph with Dramatic Peaks
Global Financial Data Analysis with Green Growth Arrows on Blue Background
Futuristic Neon Blue and Red Waveforms on Black Background
Premium
Night cityscape with illuminated skyscrapers and financial stock market chart overlay showing global trade data and growth trends in economy.
Digital Candlestick Chart on Trading Platform Screen
Futuristic Data Analytics Concept with Glowing Line Graph
Trade Chart Real-time Updates on Financial Data Screen
Futuristic Digital Interface with Rotating Elements and Waveform
Premium
Stock market growth vector with green candlestick chart and rising lines. Ideal for illustrating profit, success, investment growth, financial gain, and bullish economic trends in business media.
Neon Green Financial Line Charts Showing Market Growth and Upward Trading Trends
Pulsing Orange Waveform Intersecting C++ Code and Math with Neon Magenta Glow
Financial Data Analysis on Black Background with Graphs
Dynamic Line Graphs Displaying Financial Trends on Black Background
Abstract Financial Stock Market Graph Overlay on Digital Interface
Dynamic Stock Market Data on Black Background
Premium
Financial growth chart with rising stock market data. Colorful trend line and candlestick graph for business analysis.
Fluctuating Financial Graph with Red Line on Green Grid
Surprising Drop in Digital Stock Market Chart Visualization
Dynamic Financial Graphs Displaying Market Trends
Dynamic Financial Data with Vibrant Graph Arrows
Premium
Green arrow pointing upward on financial graph. Business growth chart with rising trend line. Digital stock market data visualization for investment analysis
Abstract Financial Chart Over Modern Cityscape
Financial Data Line Graph on Digital Display
Digital Data Overlay on Urban Roadway Financial Concept
Economic Turmoil Highlighted by Slumpflation Conceptual Graph
Premium
Financial market data displayed as a digital chart with multiple graphs and candlestick patterns, representing stock trends and economic analysis
Futuristic Digital Data Graphs and World Map
Dynamic Green Stock Market Chart with Upward Arrows
Upward Stock Market Arrow with Binary Code Background
Global Financial Data Analysis with Colorful Graphs
Premium
macro icon of transparent 3d financial growth chart with stock market candlestick bars.
Dynamic Stock Market Analysis with Digital Graph Lines
Colorful Waveforms on Blue Background
Dynamic Data Visualization of Financial Graph Trends
Colorful Line Graphs with Candlestick Markers on Digital Interface
Premium
Night cityscape backdrop with dynamic stock market graph overlaid
Futuristic Financial Data Analytics with Particle Visualization
Abstract Digital Interface with Fluctuating Line Graph
Neon Blue ECG Waveform on Futuristic Digital Grid Background
Neon Cyberpunk Stock Market Chart Pointing Vertical Arrow Highlighting 73.65 Spike Trend
Premium
Dynamic financial growth overlaid on American flag, symbolizing economic prosperity and national progress.
Futuristic Neon Line Graphs Weaving Over Perspective Grid Dashboard for Fintech Analytics