
- Home >
- Stock Photos >
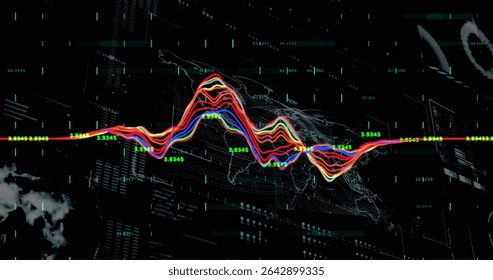
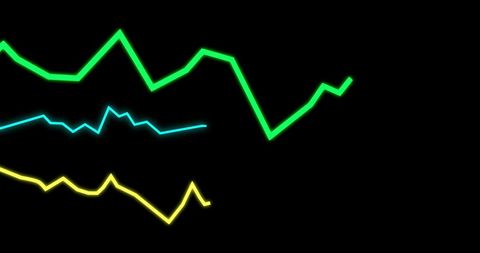
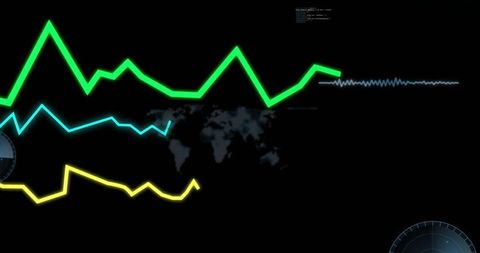
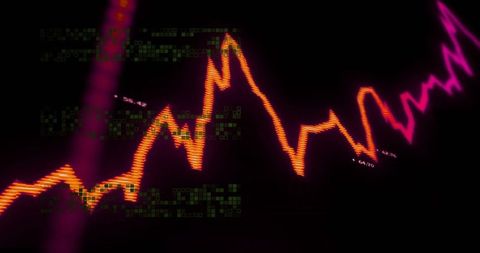
- Neon Glowing Line Graph with Numeric Data on Dark Screen
Neon Glowing Line Graph with Numeric Data on Dark Screen Image
This vibrant neon glowing line graph on a dark background captures the essence of modern data visualization. The futuristic design, accompanied by numeric labels and rectangular tags, is ideal for showcasing analytics, technological dashboards, or financial presentations. Perfect for use in articles about digital analytics, tech startups, or financial market trends.
Powered by  - Get 15% off with code: PIKWIZARD15


downloads
Tags:
More
Credit Photo
If you would like to credit the Photo, here are some ways you can do so
Text Link
photo Link
<span class="text-link">
<span>
<a target="_blank" href=https://pikwizard.com/photo/neon-glowing-line-graph-with-numeric-data-on-dark-screen/5cdc0eb3ea3710a7a41e2bcbd81ecd5d/>PikWizard</a>
</span>
</span>
<span class="image-link">
<span
style="margin: 0 0 20px 0; display: inline-block; vertical-align: middle; width: 100%;"
>
<a
target="_blank"
href="https://pikwizard.com/photo/neon-glowing-line-graph-with-numeric-data-on-dark-screen/5cdc0eb3ea3710a7a41e2bcbd81ecd5d/"
style="text-decoration: none; font-size: 10px; margin: 0;"
>
<img src="https://pikwizard.com/pw/medium/5cdc0eb3ea3710a7a41e2bcbd81ecd5d.jpg" style="margin: 0; width: 100%;" alt="" />
<p style="font-size: 12px; margin: 0;">PikWizard</p>
</a>
</span>
</span>
Free (free of charge)
Free for personal and commercial use.
Author: People Creations
Similar Free Stock Images

Premium


Premium

Premium


Premium


Premium


Premium


Premium

Premium

Premium

Premium


Premium


Premium


Premium
Premium


Premium


Premium


Premium


Premium

Premium


Premium


Premium

Premium


Premium


Premium


Premium


Explore More Free Stock Images