
- Home >
- Stock Photos >
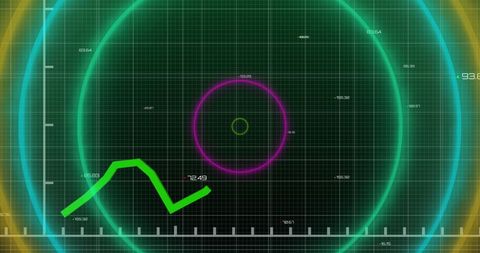
- Neon Green Circular Interface with Statistical Data Visualization
Neon Green Circular Interface with Statistical Data Visualization Image
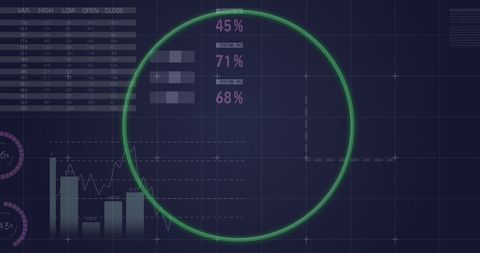
Representation of advanced data processing with a neon green circle highlighting statistical analyses. Blue background with data grids enhances a futuristic feel. Ideal for projects related to business analytics, technology solutions, data science visualization, and digital advertisements.
Powered by  - Get 15% off with code: PIKWIZARD15


downloads
Tags:
More
Credit Photo
If you would like to credit the Photo, here are some ways you can do so
Text Link
photo Link
<span class="text-link">
<span>
<a target="_blank" href=https://pikwizard.com/photo/neon-green-circular-interface-with-statistical-data-visualization/8e819a2d3cf00b05014306719bb14a31/>PikWizard</a>
</span>
</span>
<span class="image-link">
<span
style="margin: 0 0 20px 0; display: inline-block; vertical-align: middle; width: 100%;"
>
<a
target="_blank"
href="https://pikwizard.com/photo/neon-green-circular-interface-with-statistical-data-visualization/8e819a2d3cf00b05014306719bb14a31/"
style="text-decoration: none; font-size: 10px; margin: 0;"
>
<img src="https://pikwizard.com/pw/medium/8e819a2d3cf00b05014306719bb14a31.jpg" style="margin: 0; width: 100%;" alt="" />
<p style="font-size: 12px; margin: 0;">PikWizard</p>
</a>
</span>
</span>
Free (free of charge)
Free for personal and commercial use.
Author: People Creations
Similar Free Stock Images

Premium


Premium

Premium


Premium


Premium


Premium


Premium

Premium

Premium
Premium


Premium


Premium


Premium


Premium


Premium


Premium


Premium


Premium


Premium


Premium

Premium


Premium


Premium


Premium


Premium


Explore More Free Stock Images