- Home >
- Stock Photos >
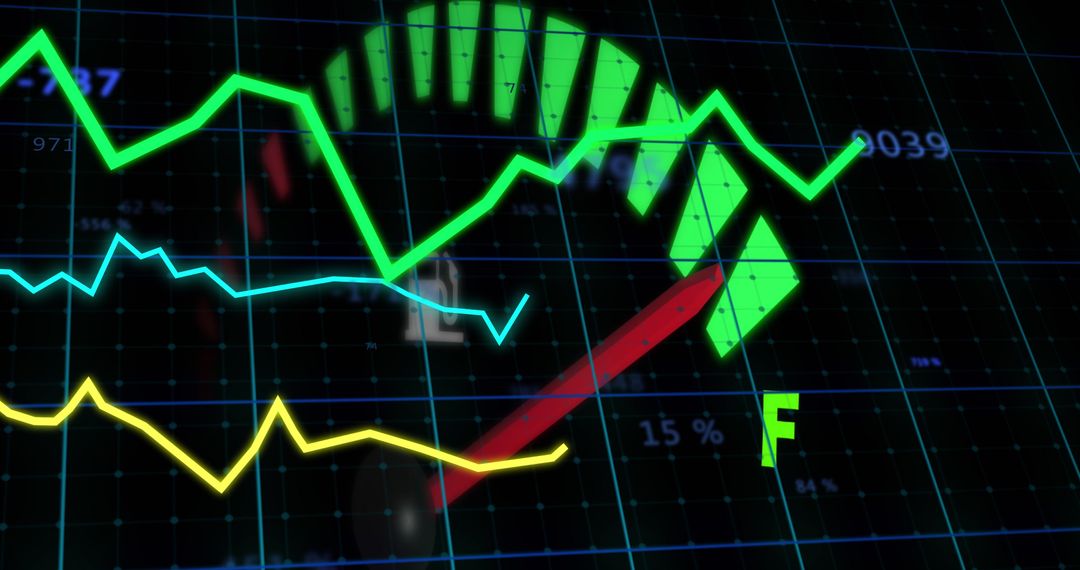
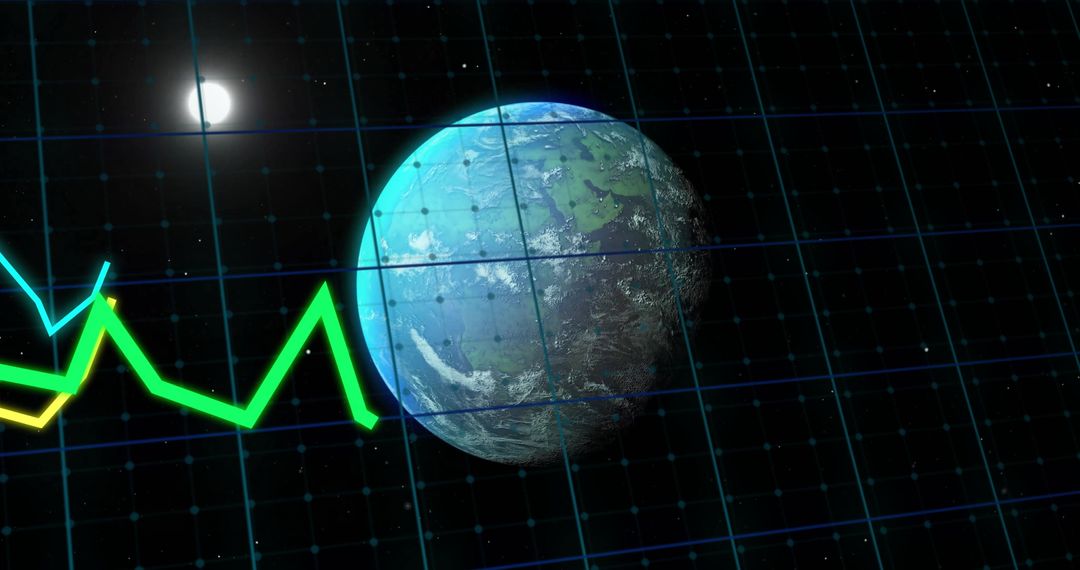
- Neon Green Line Chart Tracking Global Data Over 3D Globe with Futuristic Analytics HUD
Neon Green Line Chart Tracking Global Data Over 3D Globe with Futuristic Analytics HUD Image

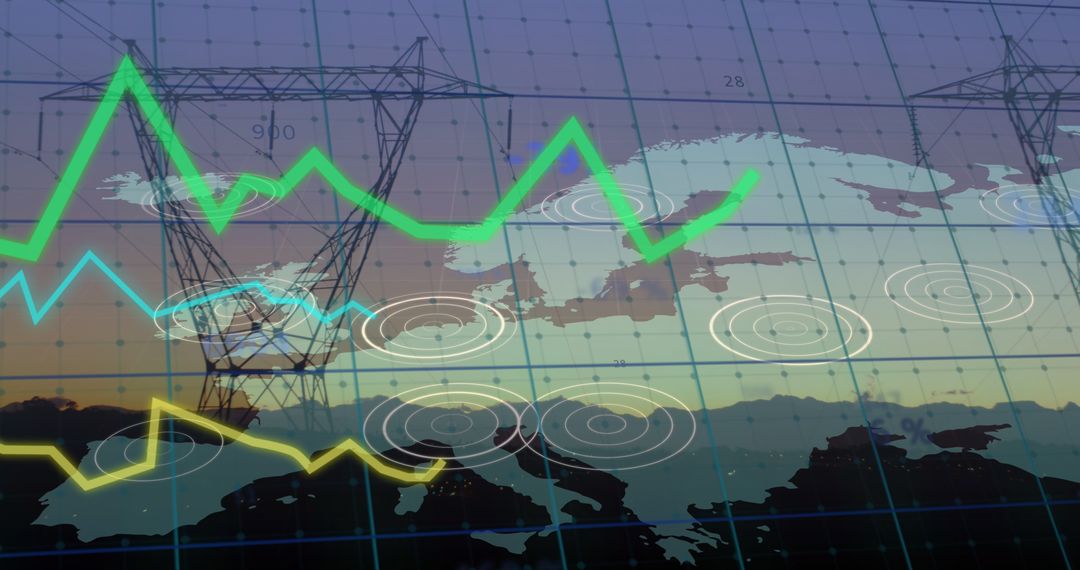
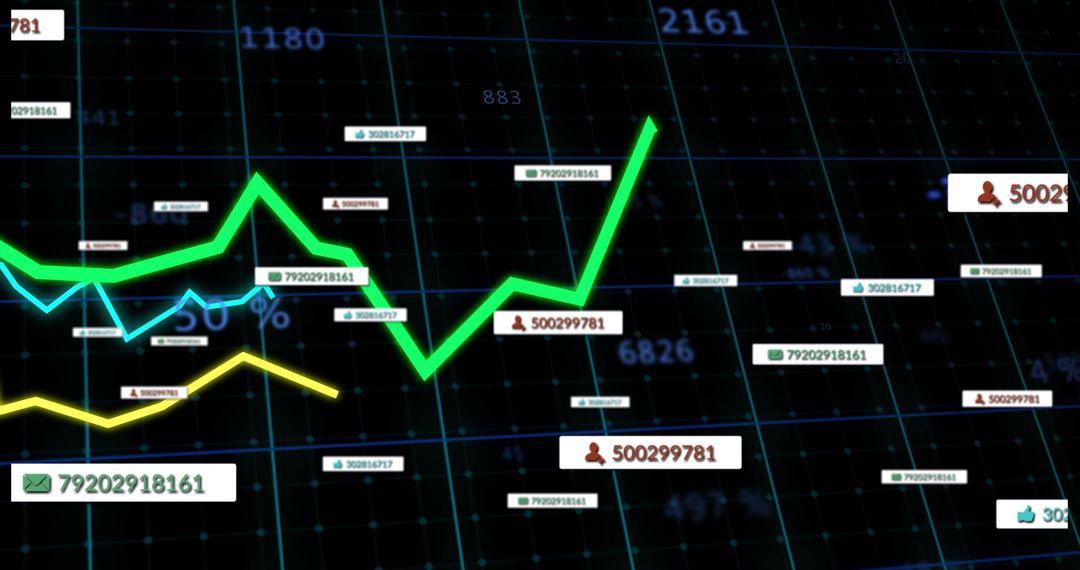
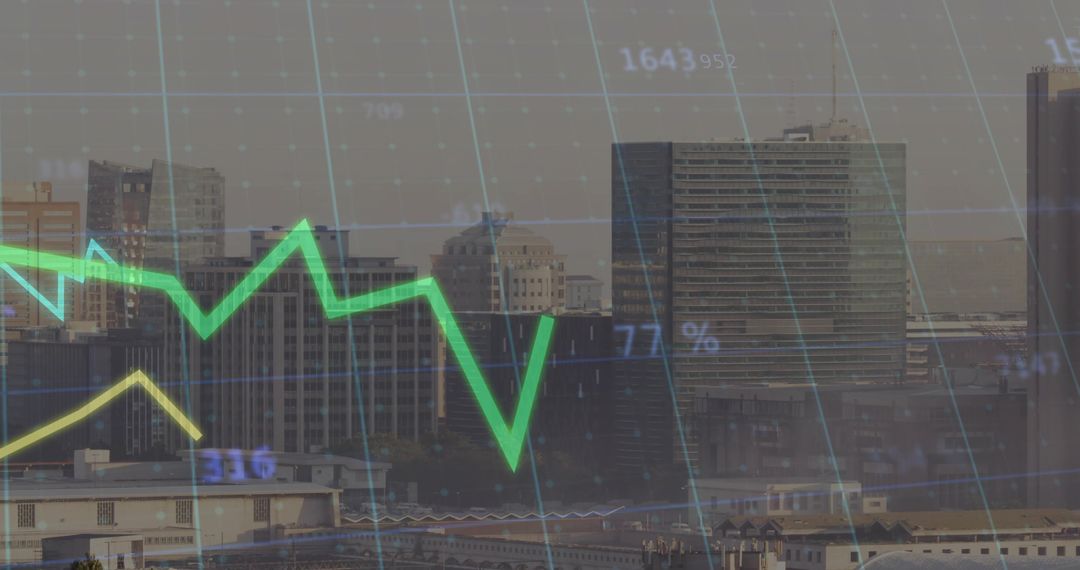
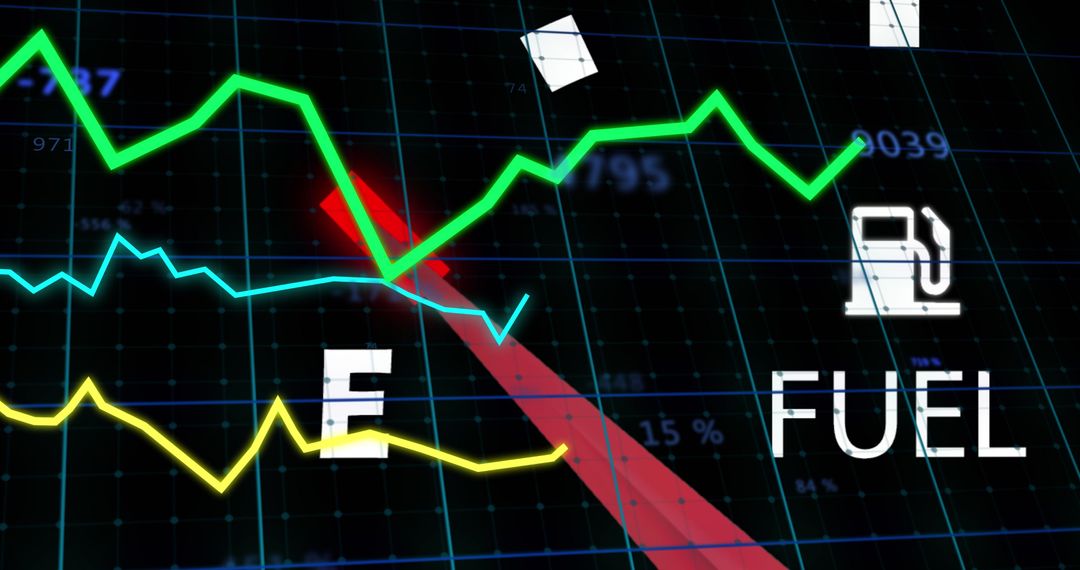
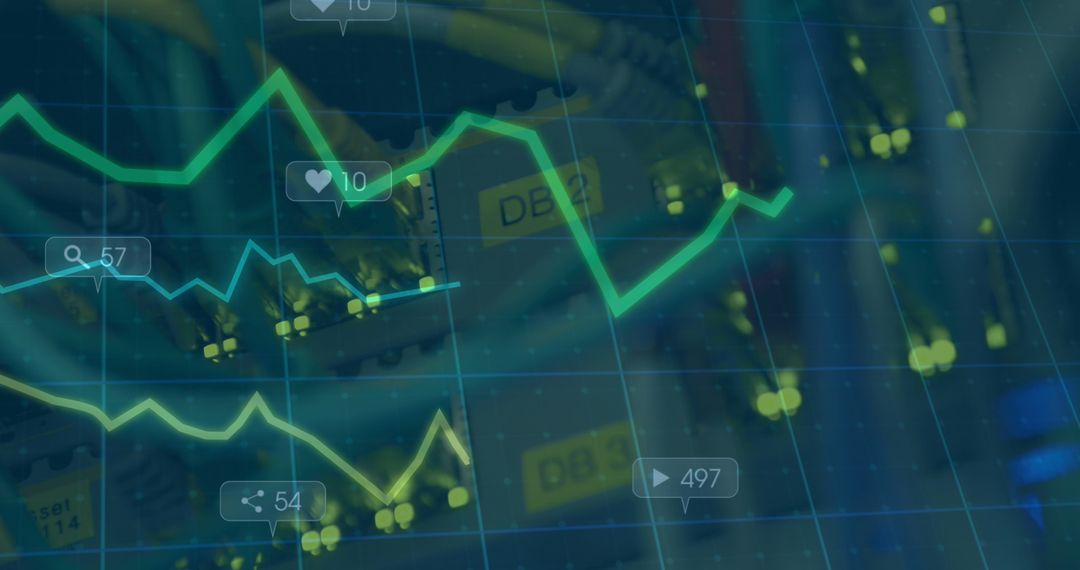
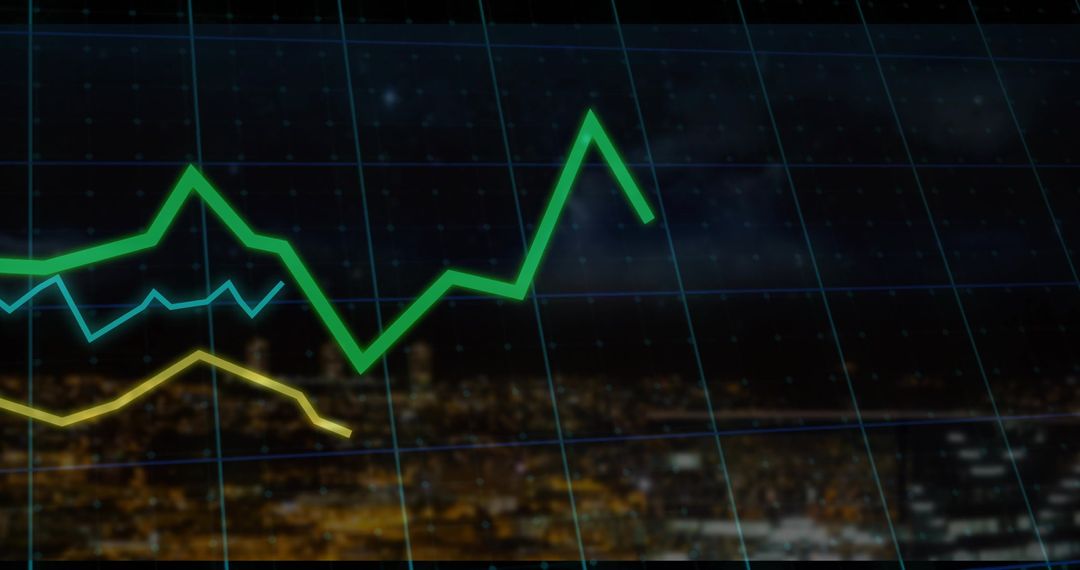
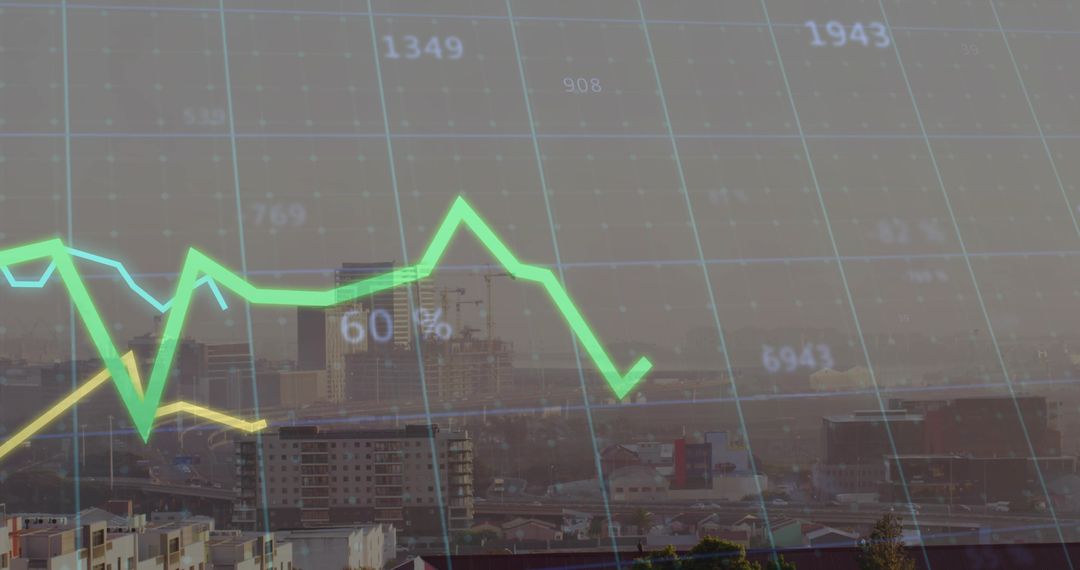
Showing neon-green line chart tracking global metrics over dotted 3D globe with cyan and yellow secondary lines and numeric overlay reading 62%. Background featuring dark grid with glowing nodes and floating data points for high-tech visual impact. Suitable for fintech presentations, market analysis reports, business intelligence dashboards, technology blog headers, and data-driven marketing campaigns. Working well as hero banner, slide background, report cover, website header, app UI concept, or social media visual. Allowing overlaying of headlines, KPI figures, logos, and animated transitions for dynamic presentations. Color palette emphasizing neon green and cyan contrasts for clear trend highlighting and modern futuristic mood.
Powered by 


0
downloads
downloads
Tags:
More
Credit Photo
If you would like to credit the Photo, here are some ways you can do so
Text Link
photo Link
<span class="text-link">
<span>
<a target="_blank" href=https://pikwizard.com/photo/neon-green-line-chart-tracking-global-data-over-3d-globe-with-futuristic-analytics-hud/544c873cdd344f655cc3b11861aa53c7/>PikWizard</a>
</span>
</span>
<span class="image-link">
<span
style="margin: 0 0 20px 0; display: inline-block; vertical-align: middle; width: 100%;"
>
<a
target="_blank"
href="https://pikwizard.com/photo/neon-green-line-chart-tracking-global-data-over-3d-globe-with-futuristic-analytics-hud/544c873cdd344f655cc3b11861aa53c7/"
style="text-decoration: none; font-size: 10px; margin: 0;"
>
<img src="https://pikwizard.com/pw/medium/544c873cdd344f655cc3b11861aa53c7.jpg" style="margin: 0; width: 100%;" alt="" />
<p style="font-size: 12px; margin: 0;">PikWizard</p>
</a>
</span>
</span>
Free (free of charge)
Free for personal and commercial use.
Author: Creative Art
Similar Free Stock Images

Premium


Premium


Premium


Premium


Premium


Premium


Premium


Premium


Premium


Premium


Premium


Premium


Premium


Premium


Premium


Premium


Premium


Premium


Premium


Premium


Premium


Premium


Premium


Premium