
- Home >
- Stock Photos >
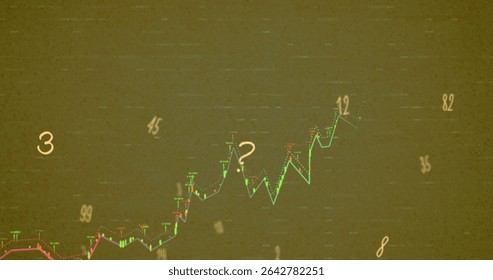
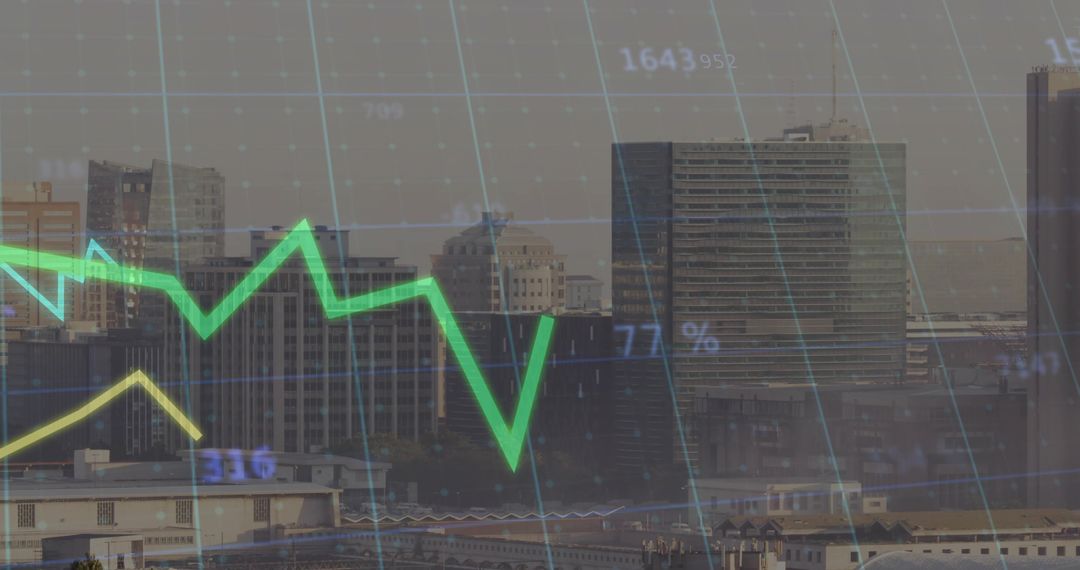
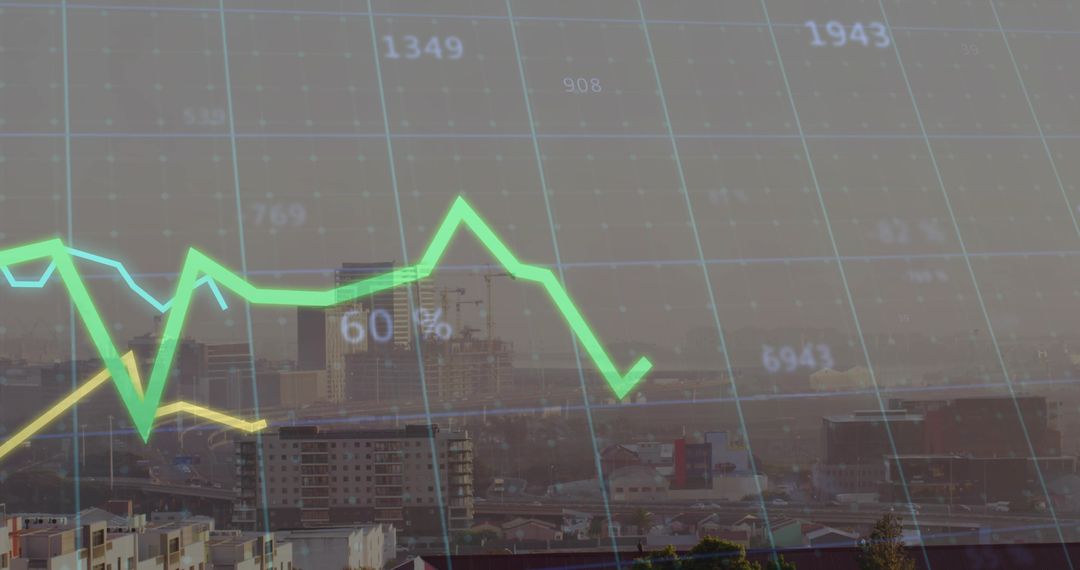
- Neon Green Market Line Chart Real-Time Financial Data on Futuristic Holographic Grid
Neon Green Market Line Chart Real-Time Financial Data on Futuristic Holographic Grid Image

Featuring neon green line chart with yellow secondary line and cyan grid over glowing numeric matrix, conveying real-time market movement. Emphasizing holographic 3D perspective and soft glow, suggesting futuristic finance interface and high-tech analytics. Serving as strong visual for fintech marketing, trading platform mockups, investor presentations, financial reports, and data analytics articles. Supporting overlays, infographics, motion graphics, and website hero banners for broadcast and social media campaigns. Allowing color and data customization for branding, educational content, pitch decks, and UI concept demonstrations.
Powered by  - Get 15% off with code: PIKWIZARD15


0
downloads
downloads
Tags:
More
Credit Photo
If you would like to credit the Photo, here are some ways you can do so
Text Link
photo Link
<span class="text-link">
<span>
<a target="_blank" href=https://pikwizard.com/photo/neon-green-market-line-chart-real-time-financial-data-on-futuristic-holographic-grid/a46fda20514e88a66693a65bb7fae0cf/>PikWizard</a>
</span>
</span>
<span class="image-link">
<span
style="margin: 0 0 20px 0; display: inline-block; vertical-align: middle; width: 100%;"
>
<a
target="_blank"
href="https://pikwizard.com/photo/neon-green-market-line-chart-real-time-financial-data-on-futuristic-holographic-grid/a46fda20514e88a66693a65bb7fae0cf/"
style="text-decoration: none; font-size: 10px; margin: 0;"
>
<img src="https://pikwizard.com/pw/medium/a46fda20514e88a66693a65bb7fae0cf.jpg" style="margin: 0; width: 100%;" alt="" />
<p style="font-size: 12px; margin: 0;">PikWizard</p>
</a>
</span>
</span>
Free (free of charge)
Free for personal and commercial use.
Author: People Creations
Similar Free Stock Images

Premium


Premium


Premium


Premium


Premium


Premium


Premium


Premium


Premium


Premium


Premium


Premium


Premium


Premium


Premium


Premium


Premium


Premium


Premium


Premium


Premium


Premium


Premium


Premium

