
- Home >
- Stock Photos >
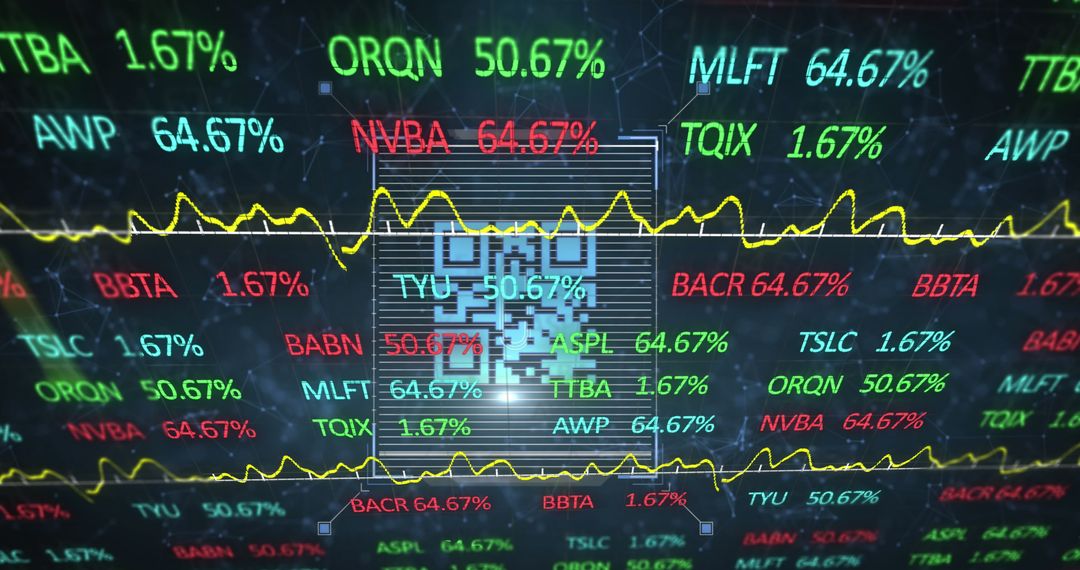
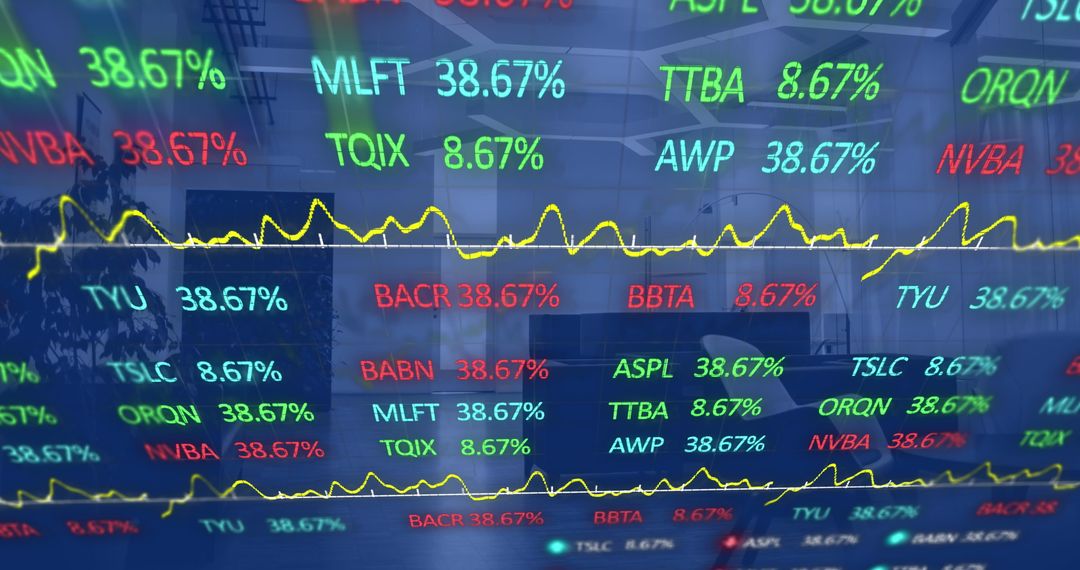
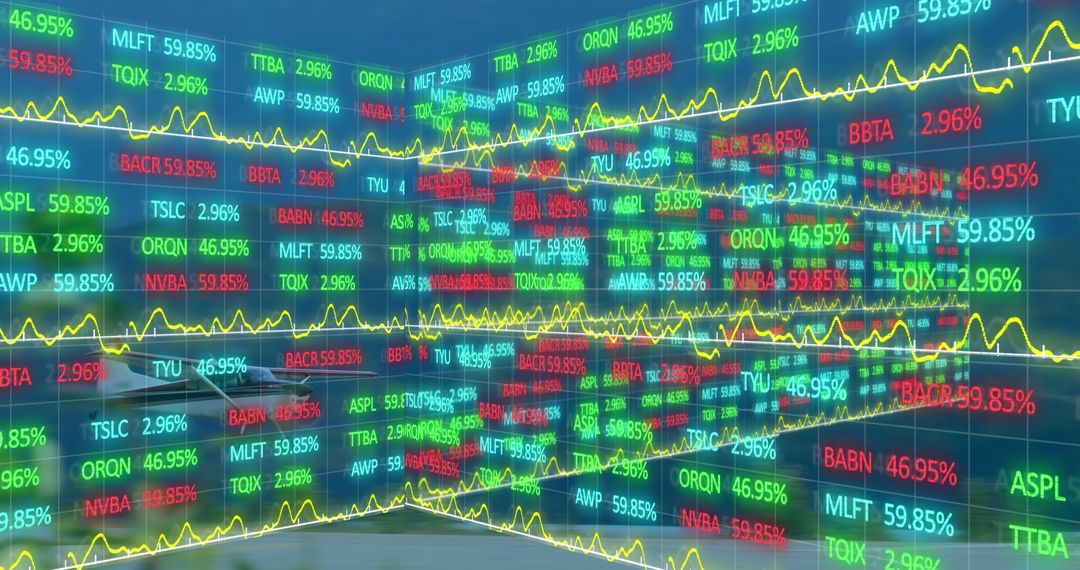
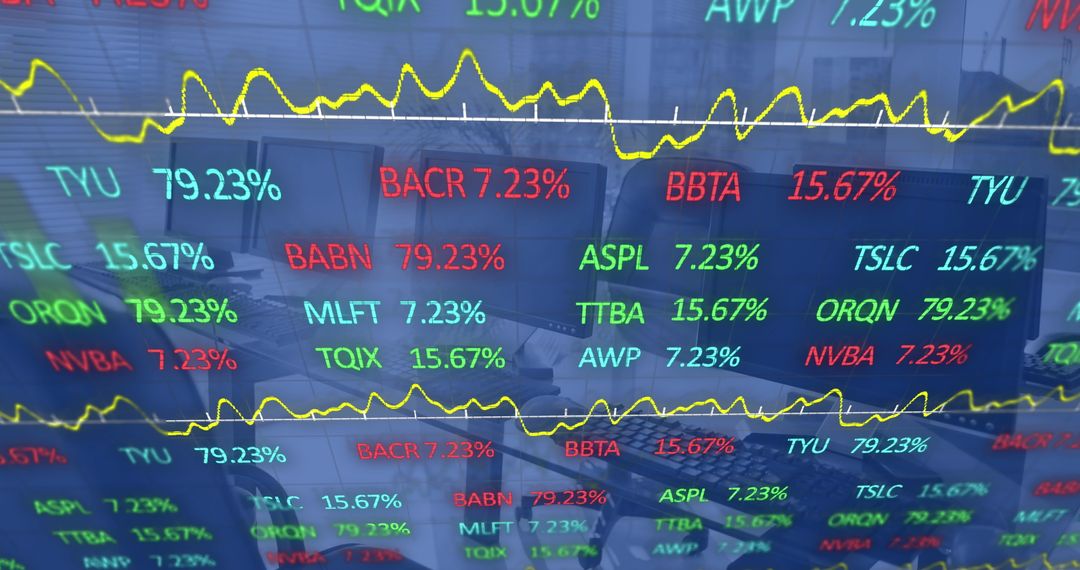
- Neon Green Stock Ticker Display Showing Live Percentages, Line Charts and Grid Data
Neon Green Stock Ticker Display Showing Live Percentages, Line Charts and Grid Data Image

Filling wide monitor with layered neon-green percentages, stock symbols and fluctuating line charts, creating high-tech trading atmosphere. Conveying fast-paced, data-driven market environment ideal for finance and investment content. Working well for hero banners, website headers, trading platform UI mockups, financial reports, blog posts about market trends, and video overlays. Allowing close-up crop for detailed number focus or full-screen background use for dramatic headers; pairing well with bold typography and semi-transparent overlays to display headlines or calls to action. Evoking urgency and high-energy pace with color palette of neon green, dark charcoal and subtle red accents for volatility highlights. Suitable for print and digital use including presentations, social media posts, advertising, editorial finance coverage, and corporate annual reports. Landscape orientation and wide aspect ratio matching monitor and dashboard layouts.
Powered by  - Get 15% off with code: PIKWIZARD15


0
downloads
downloads
Tags:
More
Credit Photo
If you would like to credit the Photo, here are some ways you can do so
Text Link
photo Link
<span class="text-link">
<span>
<a target="_blank" href=https://pikwizard.com/photo/neon-green-stock-ticker-display-showing-live-percentages-line-charts-and-grid-data/b8bfeb4019881a4e5dac3bd3fa1e4915/>PikWizard</a>
</span>
</span>
<span class="image-link">
<span
style="margin: 0 0 20px 0; display: inline-block; vertical-align: middle; width: 100%;"
>
<a
target="_blank"
href="https://pikwizard.com/photo/neon-green-stock-ticker-display-showing-live-percentages-line-charts-and-grid-data/b8bfeb4019881a4e5dac3bd3fa1e4915/"
style="text-decoration: none; font-size: 10px; margin: 0;"
>
<img src="https://pikwizard.com/pw/medium/b8bfeb4019881a4e5dac3bd3fa1e4915.jpg" style="margin: 0; width: 100%;" alt="" />
<p style="font-size: 12px; margin: 0;">PikWizard</p>
</a>
</span>
</span>
Free (free of charge)
Free for personal and commercial use.
Author: Awesome Content
Similar Free Stock Images

Premium


Premium


Premium


Premium


Premium


Premium


Premium


Premium


Premium


Premium


Premium


Premium


Premium


Premium


Premium


Premium


Premium


Premium


Premium


Premium


Premium


Premium


Premium


Premium

