
- Home >
- Stock Photos >
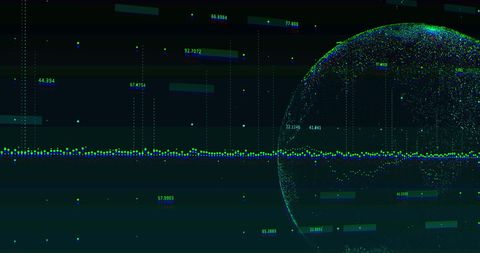
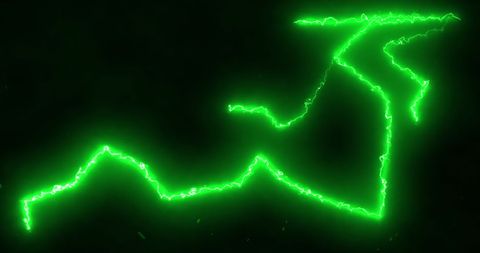
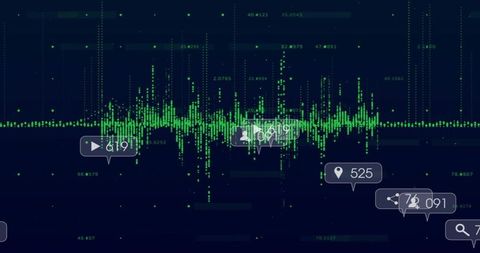
- Neon Green Waveform Visualizing Real-Time Data Stream Across Dark Tech Interface
Neon Green Waveform Visualizing Real-Time Data Stream Across Dark Tech Interface Image

Neon green waveform pulsing across dark digital interface with numeric readouts, glowing bars and drifting particles. Dense central spectrum showing peaks and troughs with dotted timeline and floating data blocks. High-contrast neon palette creating dramatic cyberpunk mood and strong focal point. Suiting hero backgrounds for tech websites and landing pages, enhancing app UI headers and dashboard mockups, branding music releases and audio production projects. Supporting cybersecurity and network monitoring visuals, complementing data analytics presentations and investor decks, enriching social media banners and digital advertising. Working well as wallpaper, slide deck cover, streaming overlay, and portfolio showcase for designers, developers, musicians and data scientists.
Powered by 


downloads
Tags:
More
Credit Photo
If you would like to credit the Photo, here are some ways you can do so
Text Link
photo Link
<span class="text-link">
<span>
<a target="_blank" href=https://pikwizard.com/photo/neon-green-waveform-visualizing-real-time-data-stream-across-dark-tech-interface/a741e97cd517ba2a4e7b903dd3964046/>PikWizard</a>
</span>
</span>
<span class="image-link">
<span
style="margin: 0 0 20px 0; display: inline-block; vertical-align: middle; width: 100%;"
>
<a
target="_blank"
href="https://pikwizard.com/photo/neon-green-waveform-visualizing-real-time-data-stream-across-dark-tech-interface/a741e97cd517ba2a4e7b903dd3964046/"
style="text-decoration: none; font-size: 10px; margin: 0;"
>
<img src="https://pikwizard.com/pw/medium/a741e97cd517ba2a4e7b903dd3964046.jpg" style="margin: 0; width: 100%;" alt="" />
<p style="font-size: 12px; margin: 0;">PikWizard</p>
</a>
</span>
</span>
Free (free of charge)
Free for personal and commercial use.
Author: Creative Art
Similar Free Stock Images

Premium


Premium


Premium


Premium


Premium


Premium
Premium


Premium


Premium


Premium


Premium


Premium


Premium


Premium

Premium

Premium


Premium


Premium


Premium


Premium


AI


Premium


AI


Premium


Premium


Premium


Premium


Explore More Free Stock Images