- Home >
- Stock Photos >
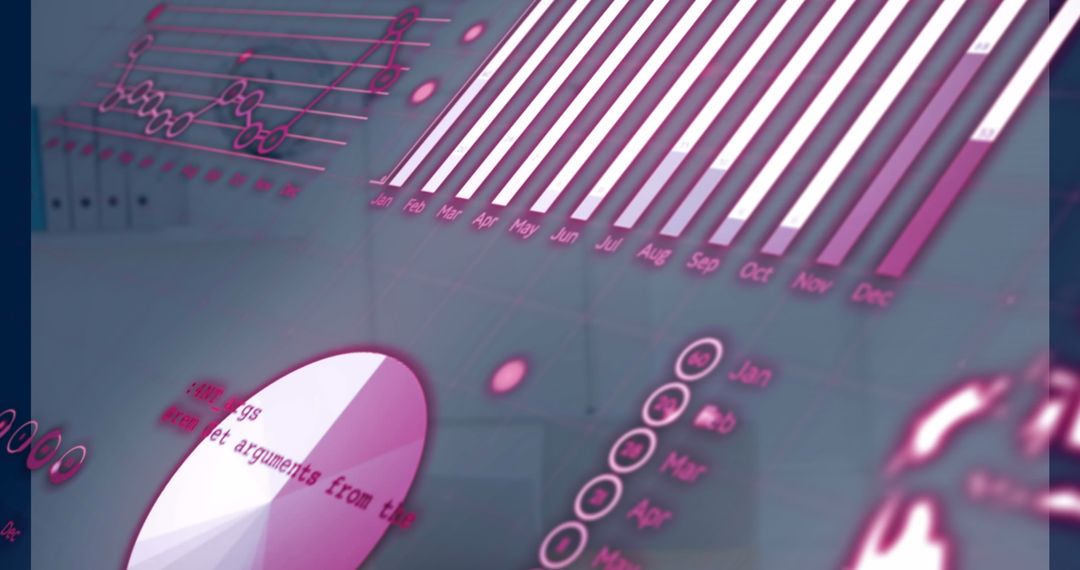
- Neon Holographic Data Dashboard Displaying 3D Radial Chart and Jan-Dec Timeline Visuals
Neon Holographic Data Dashboard Displaying 3D Radial Chart and Jan-Dec Timeline Visuals Image

Featuring neon pink and blue holographic HUD elements, 3D radial chart, Jan-Dec timeline, and layered line graphs floating over digital grid. Creating sense of depth and motion with glowing data streams, bokeh particles, and translucent overlays. Suited for fintech websites, data analytics dashboards, investor pitch decks, corporate reports, and tech blog headers. Working well as hero banner, slide background, social media post, app demo, or video overlay. Providing high-contrast visual focus for KPI highlights, quarterly reports, financial forecasts, and UX concept presentations. Enabling easy color and layer adjustments for branding and animation use.
Powered by 


0
downloads
downloads
Tags:
More
Credit Photo
If you would like to credit the Photo, here are some ways you can do so
Text Link
photo Link
<span class="text-link">
<span>
<a target="_blank" href=https://pikwizard.com/photo/neon-holographic-data-dashboard-displaying-3d-radial-chart-and-jan-dec-timeline-visuals/aed7d5d74d04da6ed03cc706d4d3ff6a/>PikWizard</a>
</span>
</span>
<span class="image-link">
<span
style="margin: 0 0 20px 0; display: inline-block; vertical-align: middle; width: 100%;"
>
<a
target="_blank"
href="https://pikwizard.com/photo/neon-holographic-data-dashboard-displaying-3d-radial-chart-and-jan-dec-timeline-visuals/aed7d5d74d04da6ed03cc706d4d3ff6a/"
style="text-decoration: none; font-size: 10px; margin: 0;"
>
<img src="https://pikwizard.com/pw/medium/aed7d5d74d04da6ed03cc706d4d3ff6a.jpg" style="margin: 0; width: 100%;" alt="" />
<p style="font-size: 12px; margin: 0;">PikWizard</p>
</a>
</span>
</span>
Free (free of charge)
Free for personal and commercial use.
Author: People Creations
Similar Free Stock Images

Premium


Premium


Premium


Premium


Premium


Premium


Premium


Premium


Premium


Premium


Premium


Premium


Premium


Premium


Premium


Premium


Premium


Premium


Premium


Premium


Premium


Premium


Premium


Premium