- Home >
- Stock Photos >
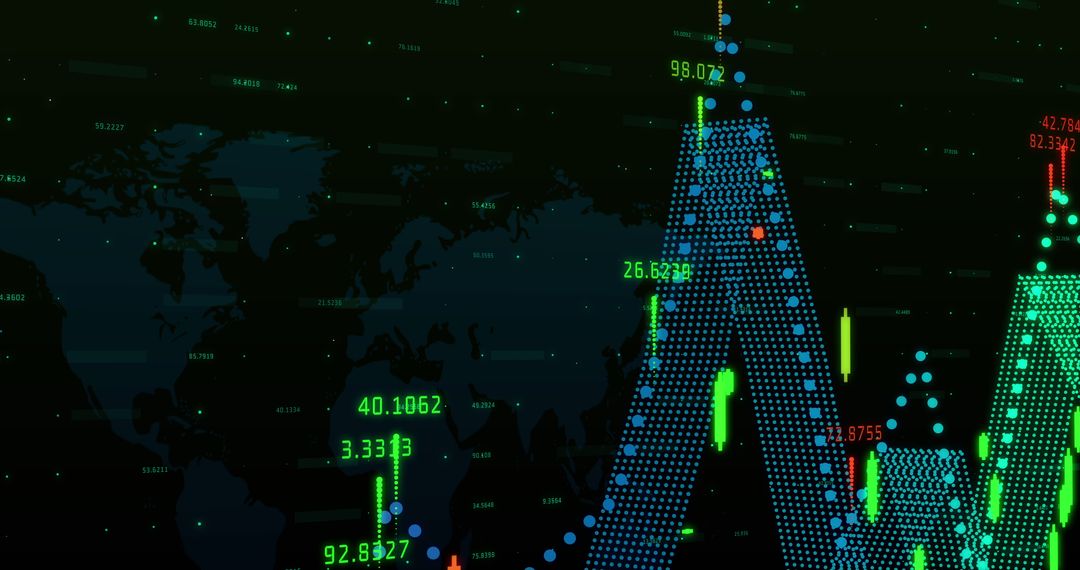
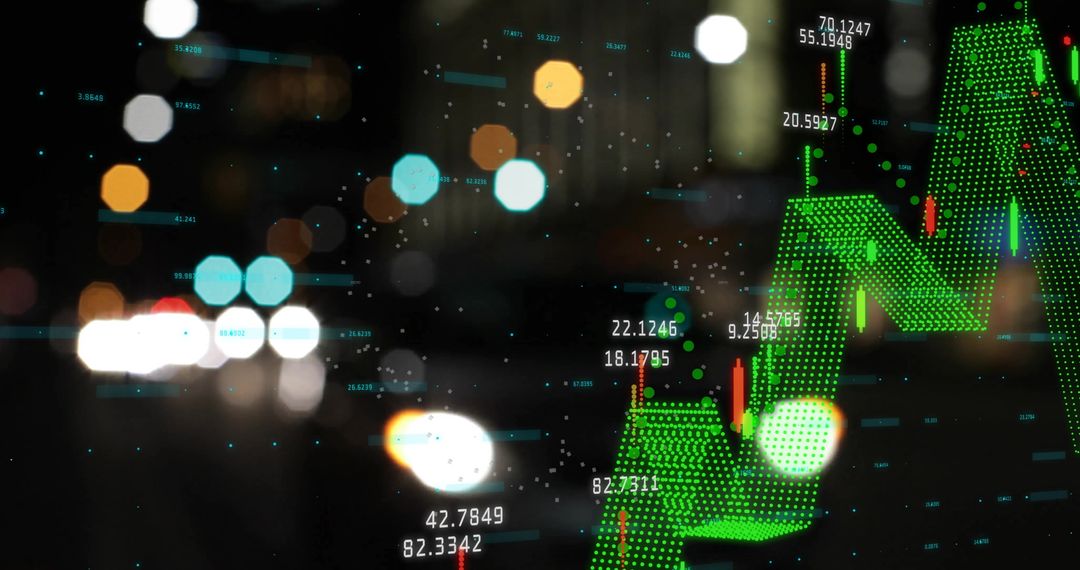
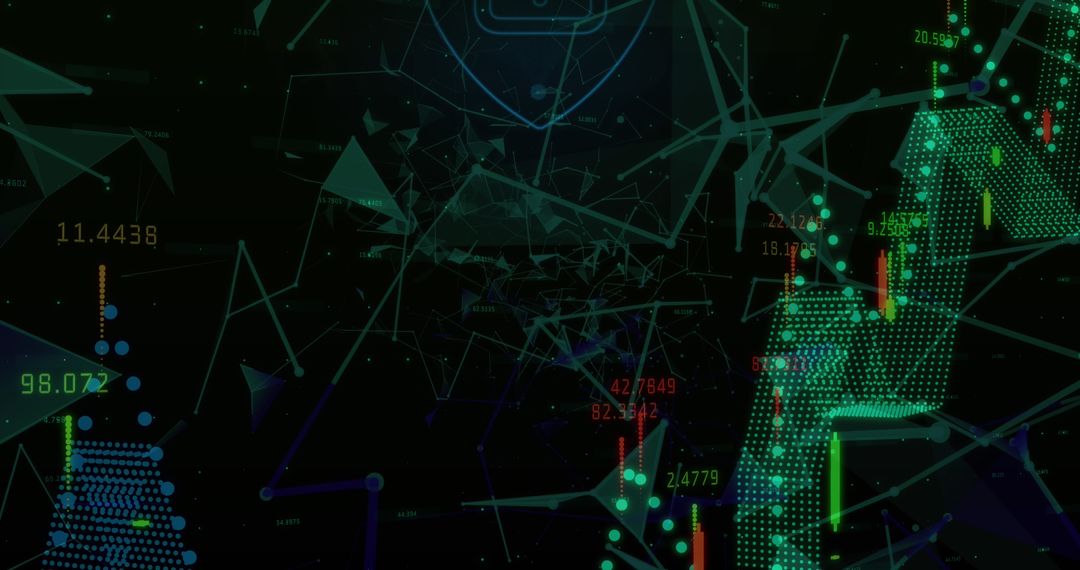
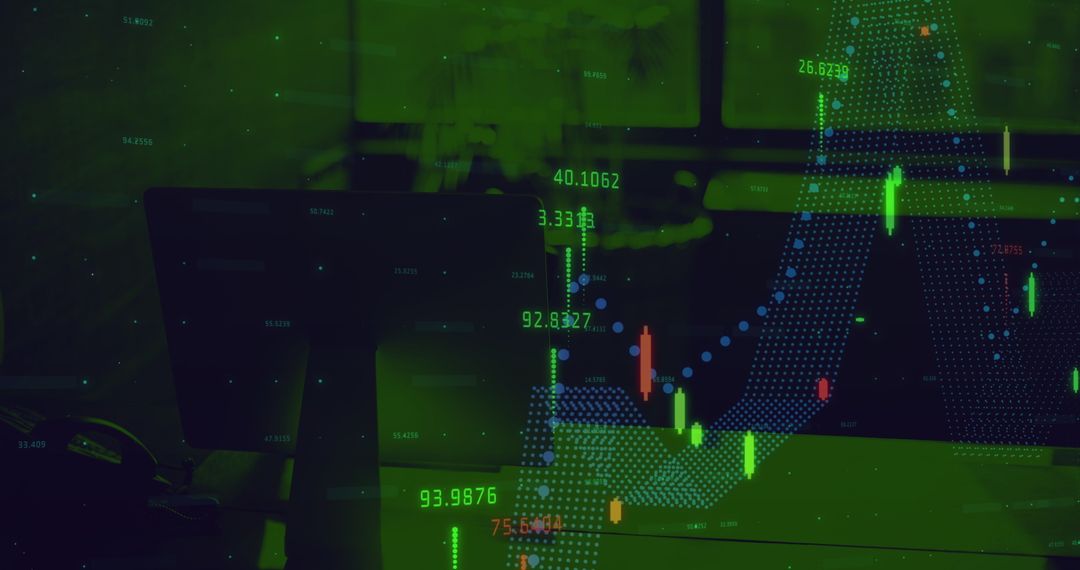
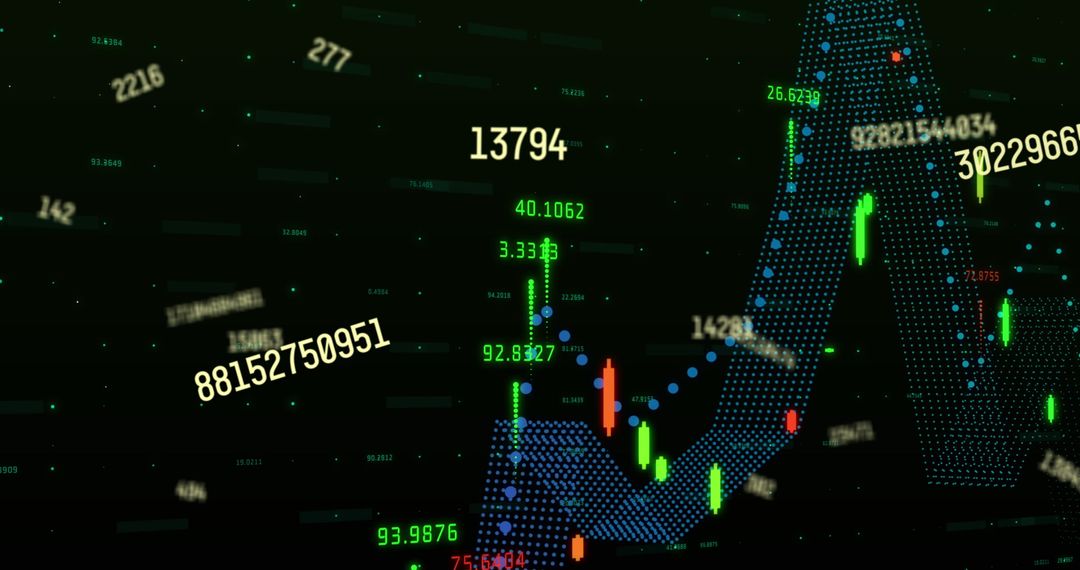
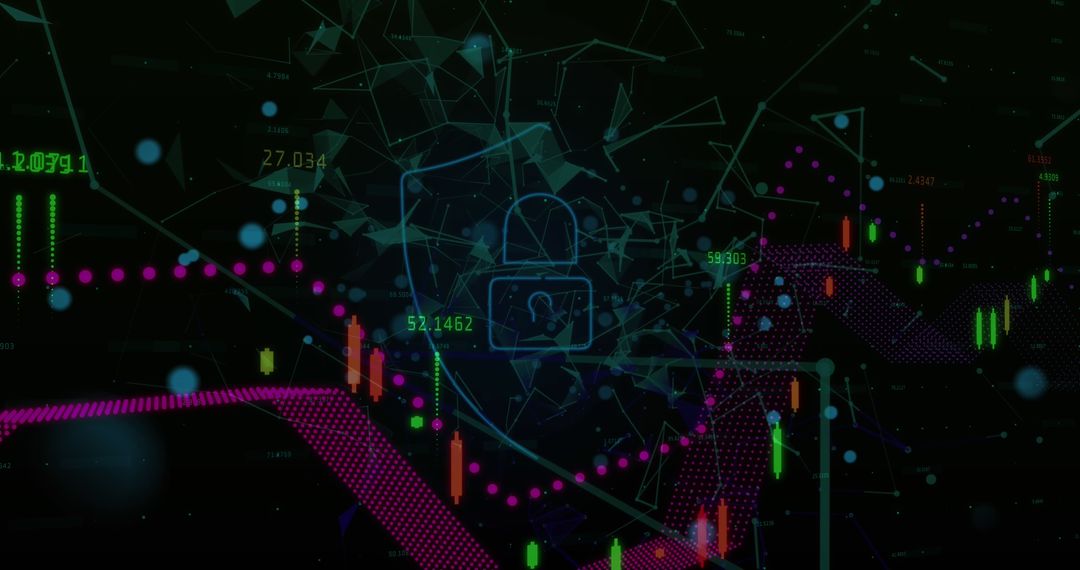
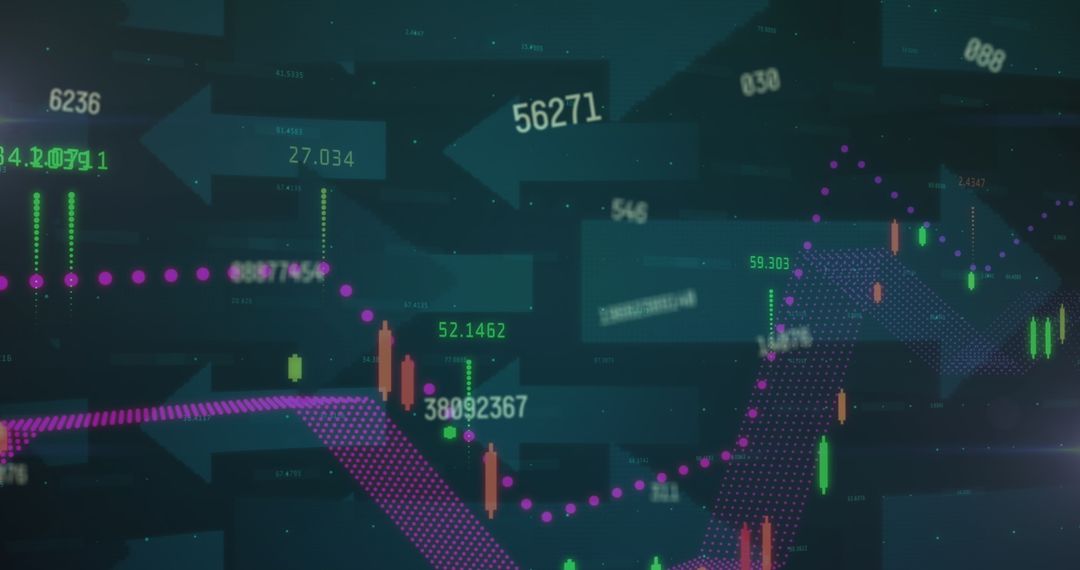
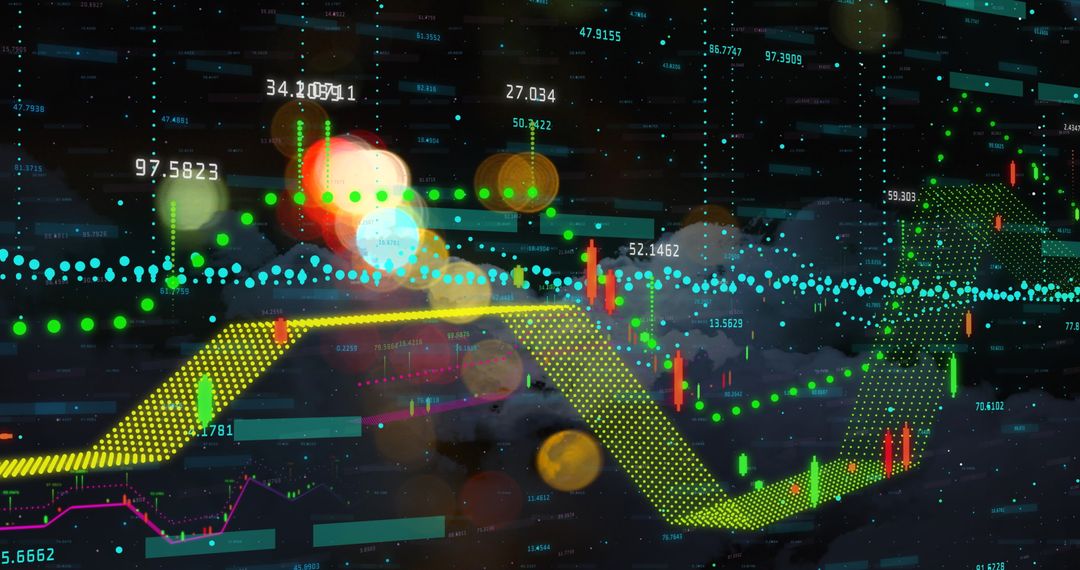
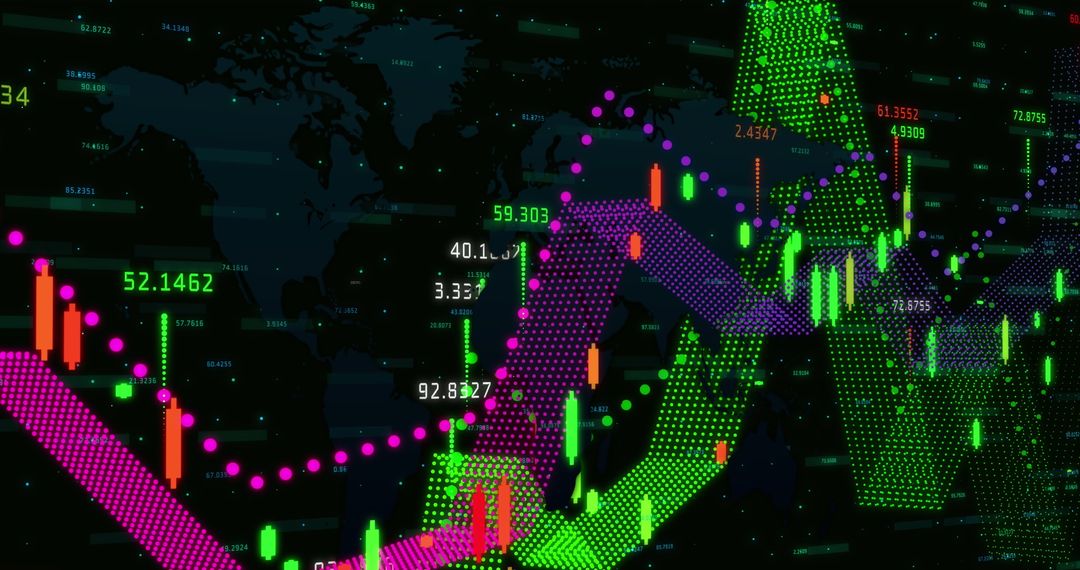
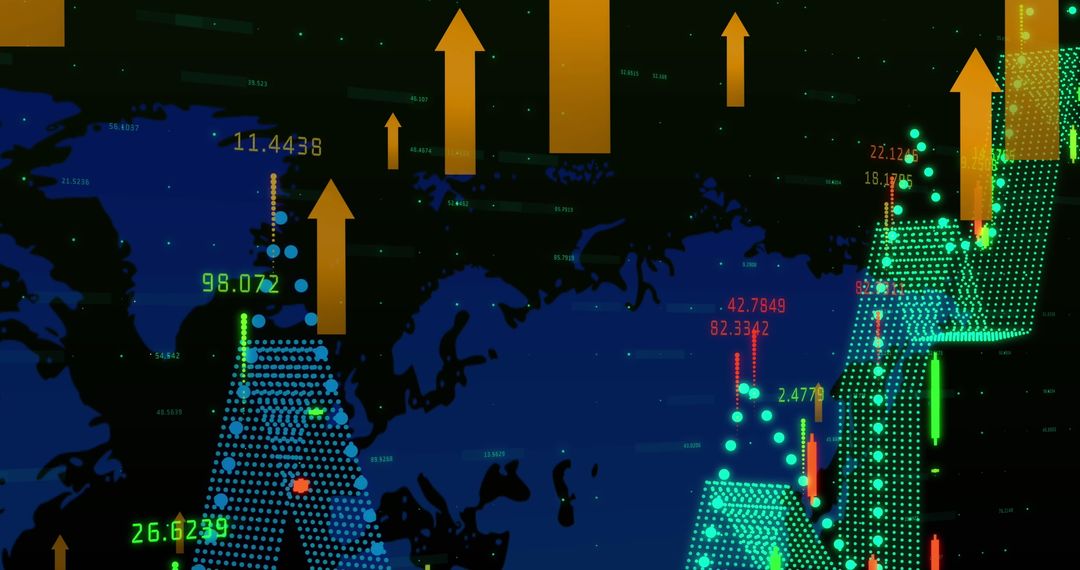
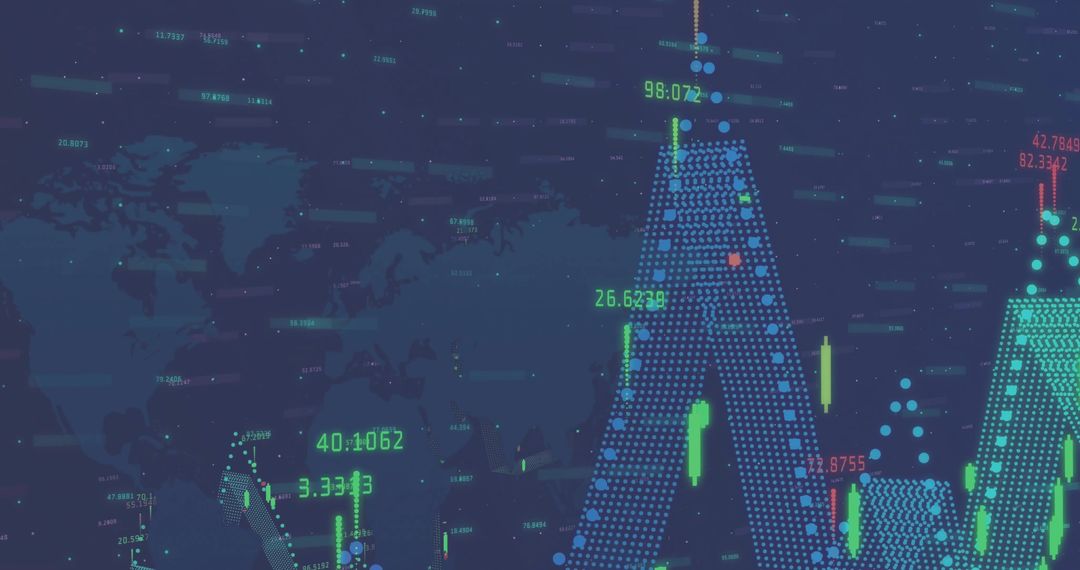
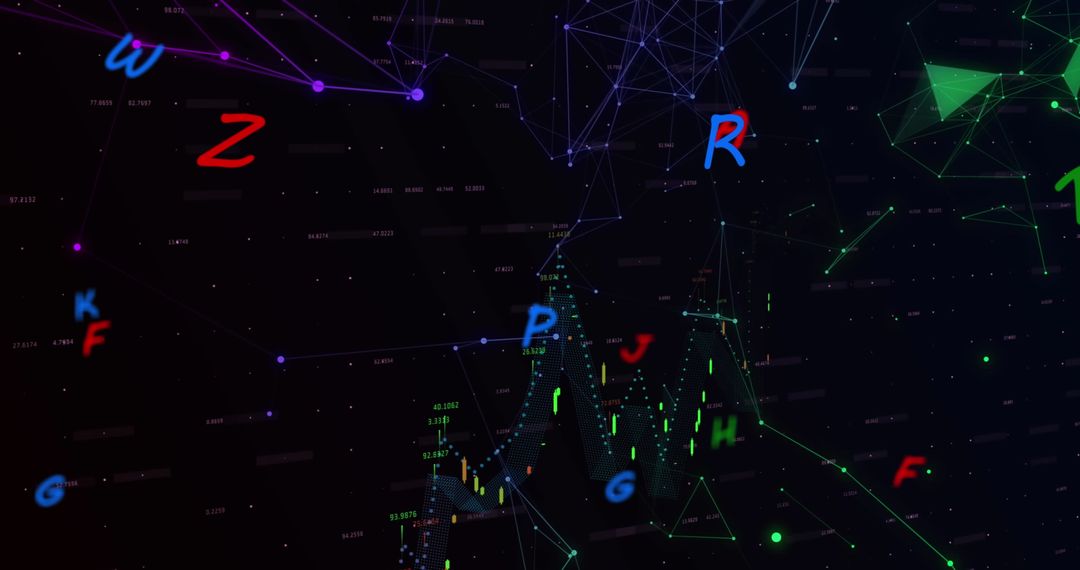
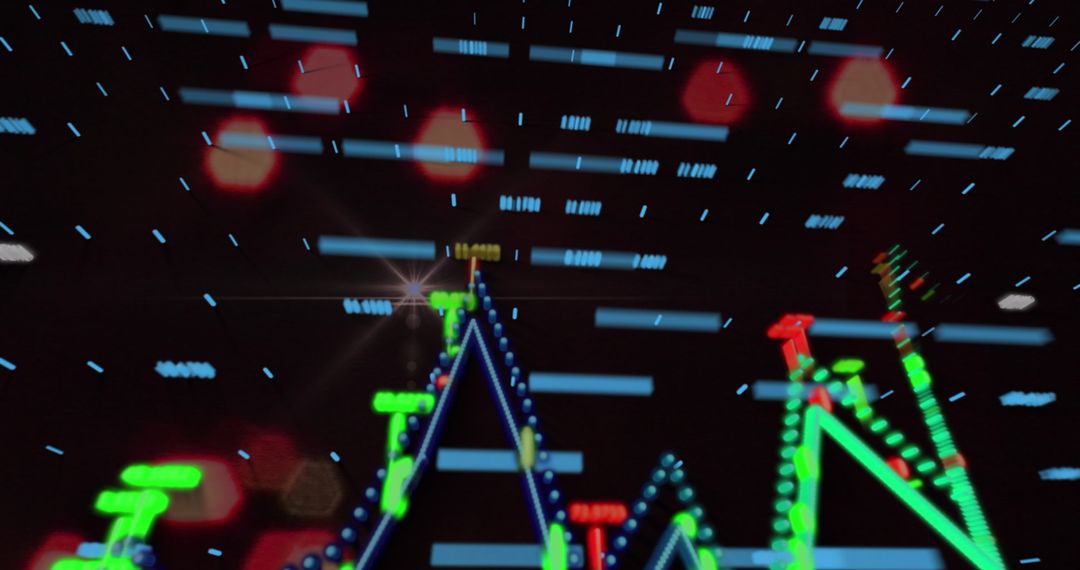
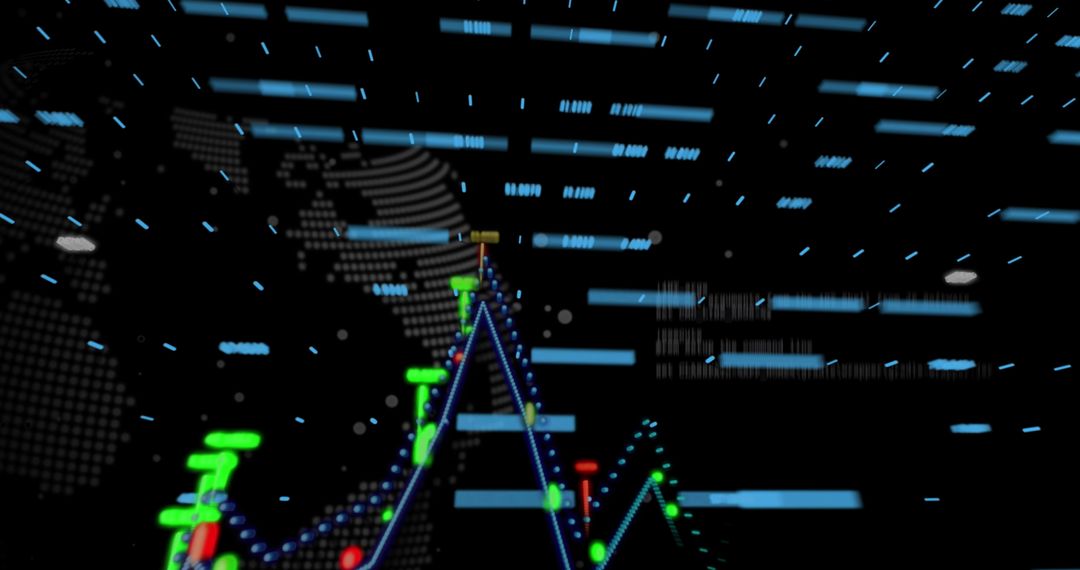
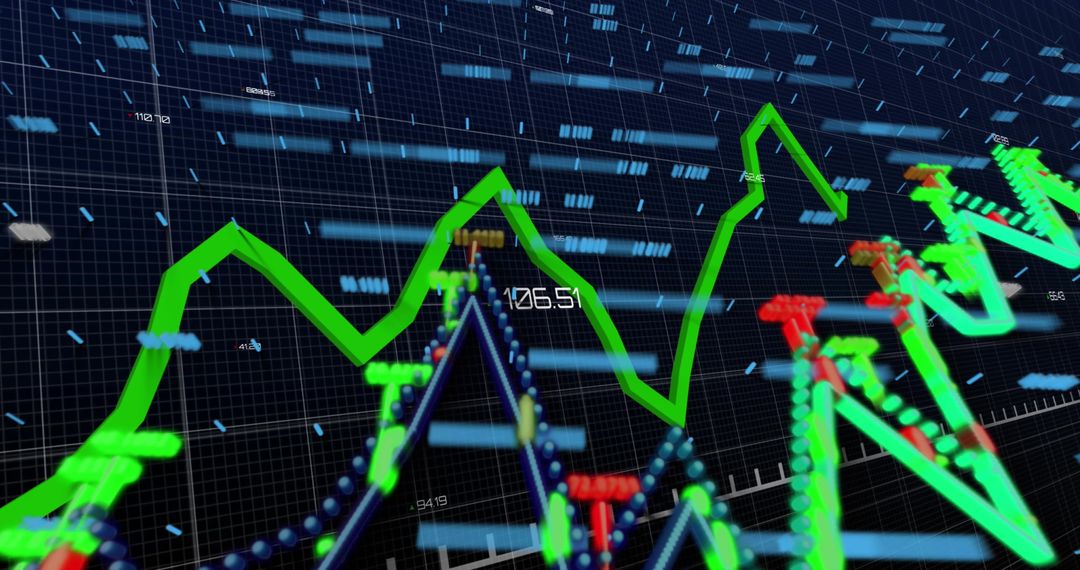
- Neon holographic trading chart showing glowing data nodes and moving zigzag lines
Neon holographic trading chart showing glowing data nodes and moving zigzag lines Image

Futuristic neon holographic trading chart showing glowing data nodes and moving zigzag lines across deep digital grid. Bright green and red markers highlighting rising and falling market trends while dotted blue line tracking secondary metric. Abstract depth and motion creating sense of high-speed data flow and real-time analytics. Serving well as background for finance visuals, fintech interfaces, trading platform dashboards, market analysis reports, investor presentations, hero banners, blog posts about stock market, social media campaigns, and corporate technology brochures. Color palette supporting dark-mode designs and neon accent themes. Recommending leaving negative space in corners for headlines or logos and applying subtle parallax or glow animation to emphasize depth and motion.
Powered by 


0
downloads
downloads
Tags:
More
Credit Photo
If you would like to credit the Photo, here are some ways you can do so
Text Link
photo Link
<span class="text-link">
<span>
<a target="_blank" href=https://pikwizard.com/photo/neon-holographic-trading-chart-showing-glowing-data-nodes-and-moving-zigzag-lines/4aca634143dc15b449cf5a52c49863fe/>PikWizard</a>
</span>
</span>
<span class="image-link">
<span
style="margin: 0 0 20px 0; display: inline-block; vertical-align: middle; width: 100%;"
>
<a
target="_blank"
href="https://pikwizard.com/photo/neon-holographic-trading-chart-showing-glowing-data-nodes-and-moving-zigzag-lines/4aca634143dc15b449cf5a52c49863fe/"
style="text-decoration: none; font-size: 10px; margin: 0;"
>
<img src="https://pikwizard.com/pw/medium/4aca634143dc15b449cf5a52c49863fe.jpg" style="margin: 0; width: 100%;" alt="" />
<p style="font-size: 12px; margin: 0;">PikWizard</p>
</a>
</span>
</span>
Free (free of charge)
Free for personal and commercial use.
Author: Awesome Content
Similar Free Stock Images
Premium


Premium


Premium


Premium


Premium


Premium


Premium


Premium


Premium


Premium


Premium


Premium


Premium


Premium


Premium

Premium


Premium


Premium


Premium


Premium


Premium


Premium


Premium

Premium