- Home >
- Stock Photos >
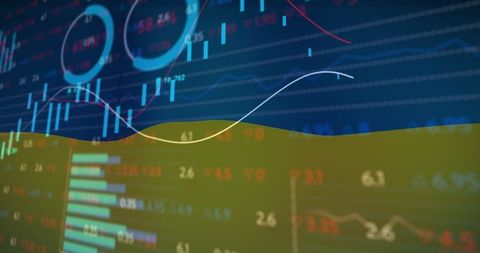
- Neon Line Charts Displaying Financial Market Trends
Neon Line Charts Displaying Financial Market Trends Image

AI Generated Image. This image shows brightly lit, neon line charts on a digital display, illustrating fluctuations in financial market trends. It combines visual clarity and aesthetic design useful for conveying technical analysis in finance or stock markets. Ideal for use in presentations focused on market trends, areas of investment research, stock trading educations, and innovative technological solutions, adding a modern vibe to financial blog posts and publications.
Powered by 


2
downloads
downloads
Tags:
More
Credit Photo
If you would like to credit the Photo, here are some ways you can do so
Text Link
photo Link
<span class="text-link">
<span>
<a target="_blank" href=https://pikwizard.com/photo/neon-line-charts-displaying-financial-market-trends/5853ff2f10e9fd42c2e56e4ee85deca1/>PikWizard</a>
</span>
</span>
<span class="image-link">
<span
style="margin: 0 0 20px 0; display: inline-block; vertical-align: middle; width: 100%;"
>
<a
target="_blank"
href="https://pikwizard.com/photo/neon-line-charts-displaying-financial-market-trends/5853ff2f10e9fd42c2e56e4ee85deca1/"
style="text-decoration: none; font-size: 10px; margin: 0;"
>
<img src="https://pikwizard.com/pw/medium/5853ff2f10e9fd42c2e56e4ee85deca1.jpg" style="margin: 0; width: 100%;" alt="" />
<p style="font-size: 12px; margin: 0;">PikWizard</p>
</a>
</span>
</span>
Free (free of charge)
Free for personal and commercial use.
Author: AI Creator
Similar Free Stock Images
Loading...

Premium


Premium


Premium


Premium


Premium


Premium

Premium


Premium

Premium


Premium


Premium


Premium


Premium

Premium


Premium


Premium


Premium


Premium


Premium


Premium


Premium

Premium


Premium

Premium


Premium