
- Home >
- Free Stock Photos & Images >
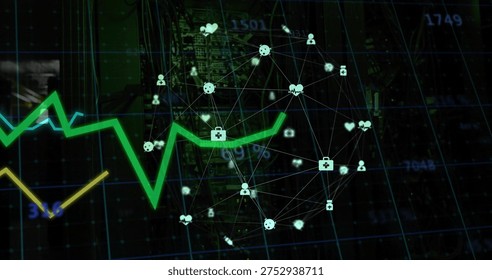
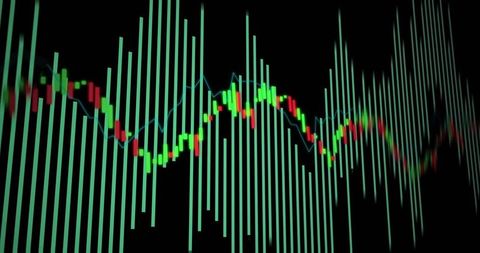
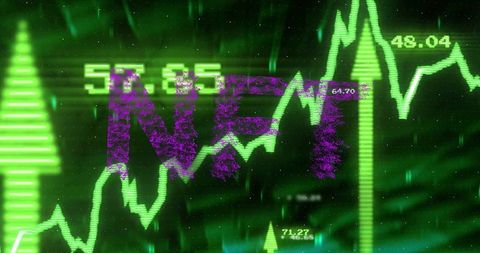
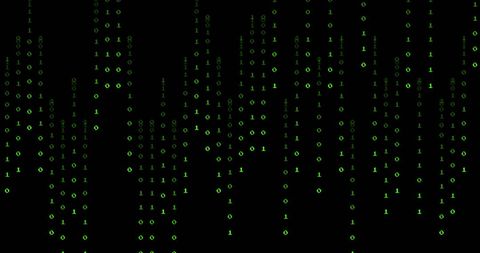
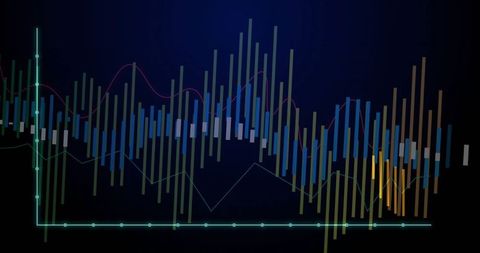
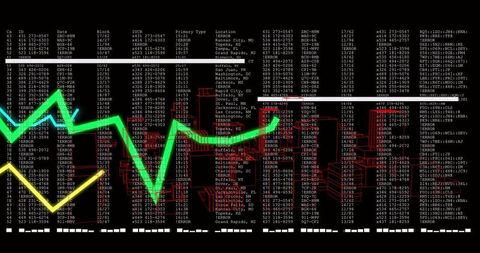
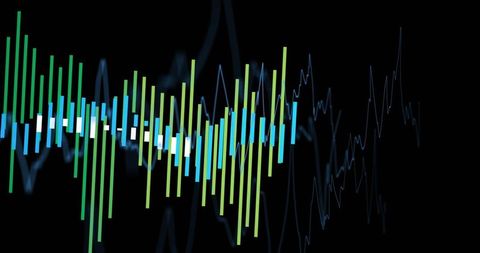
- Neon Line Graphs Pulsating Over Cascading Binary Matrix Futuristic Data Visualization
Neon Line Graphs Pulsating Over Cascading Binary Matrix Futuristic Data Visualization Free Stock Image

Displaying three neon line graphs pulsing over cascading binary digits on black background, with bright green, cyan, and yellow traces creating high-contrast tech aesthetic. Visualizing fluctuating data trends, comparative analytics, and real-time monitoring within stylized cyber grid. Serving as hero art for fintech platforms, cybersecurity articles, data science blogs, cryptocurrency reports, startup pitch decks, and technology marketing. Enhancing headers, banners, social media posts, slides, infographics, and website hero sections. Leaving negative space on right side for text overlay or logo placement; cropping to widescreen formats for web banners and presentation slides. Recommending high-contrast typography and minimal icons to preserve futuristic feel. Offering versatile use for editorial stories about market volatility, predictive analytics, AI dashboards, and data-driven visual communications.
Powered by  - Get 15% off with code: PIKWIZARD15


downloads
Tags:
More
Credit Photo
If you would like to credit the Photo, here are some ways you can do so
Text Link
photo Link
<span class="text-link">
<span>
<a target="_blank" href=https://pikwizard.com/photo/neon-line-graphs-pulsating-over-cascading-binary-matrix-futuristic-data-visualization/c58e3aa3b42d379fbd933b8a39d9fe32/>PikWizard</a>
</span>
</span>
<span class="image-link">
<span
style="margin: 0 0 20px 0; display: inline-block; vertical-align: middle; width: 100%;"
>
<a
target="_blank"
href="https://pikwizard.com/photo/neon-line-graphs-pulsating-over-cascading-binary-matrix-futuristic-data-visualization/c58e3aa3b42d379fbd933b8a39d9fe32/"
style="text-decoration: none; font-size: 10px; margin: 0;"
>
<img src="https://thumbs.wbm.im/pw/medium/c58e3aa3b42d379fbd933b8a39d9fe32.jpg" style="margin: 0; width: 100%;" alt="Neon Line Graphs Pulsating Over Cascading Binary Matrix Futuristic Data Visualization" />
<p style="font-size: 12px; margin: 0;">PikWizard</p>
</a>
</span>
</span>
Free (free of charge)
Free for personal and commercial use.
Author: Authentic Images
Similar Free Stock Images


Premium


Premium


AI

Premium


Premium


Premium


Premium


Premium


Premium


AI


Premium


Premium


Premium


Premium


Premium


Premium


Premium


Premium


Premium


Premium


Premium


Premium


Premium


Premium


Premium


Premium


Premium

Explore More Free Stock Images