- Home >
- Free Stock Photos & Images >
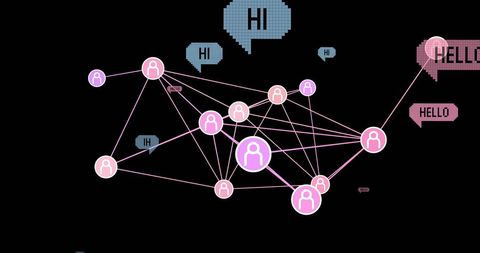
- Neon network visualization showing interconnected user nodes and data analytics dashboard
Neon network visualization showing interconnected user nodes and data analytics dashboard Free Stock Image

Featuring neon pink and purple user nodes connected by thin glowing lines over deep blue grid and translucent bar and pie charts. Highlighting hub nodes, cluster connections, and floating numeric metrics for sense of data flow and network activity. Serving well for technology marketing, data science presentations, cybersecurity reports, network topology guides, and startup websites. Working well as hero banner, slide background, blog header, social media post, product page visual, and investor deck cover. Allowing overlay of headline and call to action by leaving negative space at top-left and right margins. Providing modern, futuristic look for branding, editorial, and advertising about connectivity, analytics, and AI.

downloads
Credit Photo
If you would like to credit the Photo, here are some ways you can do so
Free (free of charge)
Free for personal and commercial use.
Author: Authentic Images