- Home >
- Stock Photos >
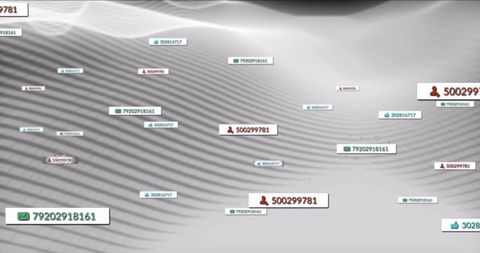
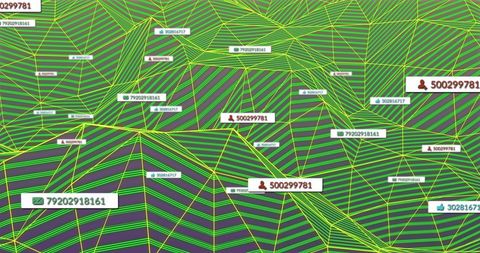
- Neon Network Visualization Showing User ID Nodes, Dataflow, Analytics on Purple Grid
Neon Network Visualization Showing User ID Nodes, Dataflow, Analytics on Purple Grid Image

Depicting stylized network graph with floating ID labels, user icons, dotted connection lines, and node clusters over neon purple grid. Featuring layered data points, curved data flows, and subtle code elements for technical feel. Conveying themes of digital connectivity, data analytics, cybersecurity, and user mapping. Working well for technology website headers, presentation slides about big data or network analysis, marketing campaigns for cloud services or cybersecurity, editorial articles on data privacy, product pages for analytics tools, and background art for fintech or AI concepts. Allowing tight crops around key nodes for hero banner or wide crops for full-screen background; enabling color adjustments and overlay blend modes to match brand palette. Offering high-contrast neon palette for bold visual impact and easy overlay of text or logo.

downloads
Credit Photo
If you would like to credit the Photo, here are some ways you can do so
Free (free of charge)
Free for personal and commercial use.
Author: Authentic Images