- Home >
- Stock Photos >
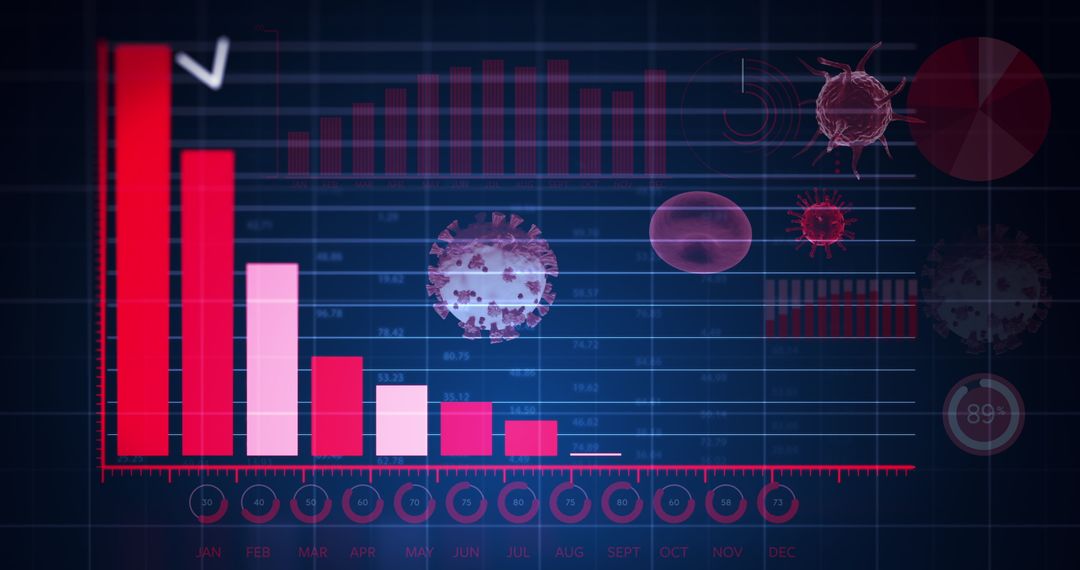
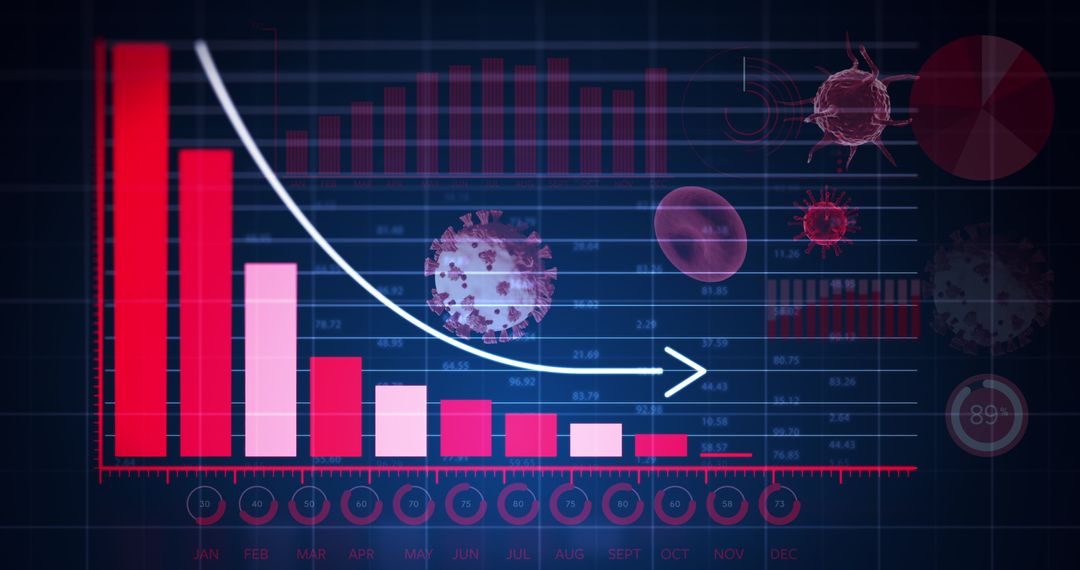
- Neon Red Data Bar Chart with Floating Virus Icons
Neon Red Data Bar Chart with Floating Virus Icons Image

Vivid visualization of neon data charts featuring bar plots and floating virus icons. Capturing the confluence of digital interface and analytics, this scene embodies futuristic data interaction. Ideal for illustrating global trends in securities and technology, especially in the context of economic impacts or healthcare scenarios.
Powered by  - Get 15% off with code: PIKWIZARD15


2
downloads
downloads
Tags:
More
Credit Photo
If you would like to credit the Photo, here are some ways you can do so
Text Link
photo Link
<span class="text-link">
<span>
<a target="_blank" href=https://pikwizard.com/photo/neon-red-data-bar-chart-with-floating-virus-icons/181337fefbf2c114d185d9f8ba748f76/>PikWizard</a>
</span>
</span>
<span class="image-link">
<span
style="margin: 0 0 20px 0; display: inline-block; vertical-align: middle; width: 100%;"
>
<a
target="_blank"
href="https://pikwizard.com/photo/neon-red-data-bar-chart-with-floating-virus-icons/181337fefbf2c114d185d9f8ba748f76/"
style="text-decoration: none; font-size: 10px; margin: 0;"
>
<img src="https://pikwizard.com/pw/medium/181337fefbf2c114d185d9f8ba748f76.jpg" style="margin: 0; width: 100%;" alt="" />
<p style="font-size: 12px; margin: 0;">PikWizard</p>
</a>
</span>
</span>
Free (free of charge)
Free for personal and commercial use.
Author: People Creations