- Home >
- Stock Photos >
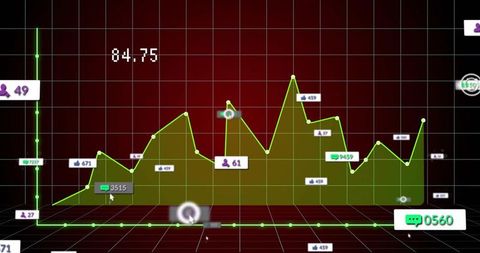
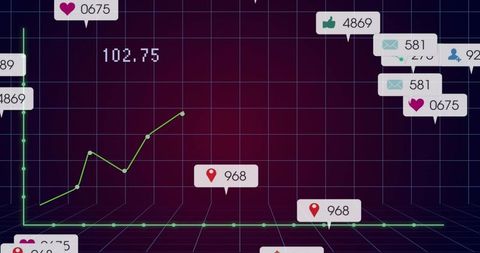
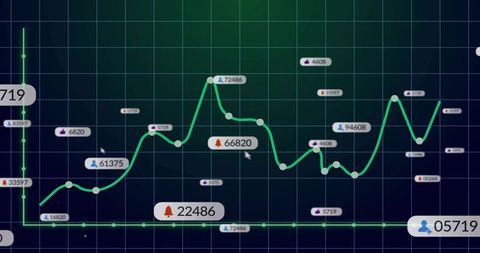
- Neon Red Market Trend Line with Social Media Engagement Callouts on Green Data Grid
Neon Red Market Trend Line with Social Media Engagement Callouts on Green Data Grid Image

Vivid graphic featuring neon red jagged trend line moving across dark green grid with translucent social media callouts showing likes, comments, notifications, and location markers. Composition emphasizing data-driven storytelling for marketing, finance, and tech presentations. Ideal for website hero banners, social reports, blog headers, app dashboards, investor decks, and marketing campaigns. Useful for illustrating engagement metrics, performance tracking, market volatility, digital analytics, and user activity. Layout allowing overlaying headline text or KPI widgets without losing visual impact. Color palette suggestion pairing neon reds with deep greens and subtle gradients for high-contrast display. Export tips including producing large-resolution PNG for presentations, optimizing JPEG for web, and keeping layered source file for custom edits. Creative ideas including animating line and callouts for video intros, social ads, or interactive dashboards.
Powered by 


0
downloads
downloads
Tags:
More
Credit Photo
If you would like to credit the Photo, here are some ways you can do so
Text Link
photo Link
<span class="text-link">
<span>
<a target="_blank" href=https://pikwizard.com/photo/neon-red-market-trend-line-with-social-media-engagement-callouts-on-green-data-grid/64a1ff7b66b45477a039e03918ff480a/>PikWizard</a>
</span>
</span>
<span class="image-link">
<span
style="margin: 0 0 20px 0; display: inline-block; vertical-align: middle; width: 100%;"
>
<a
target="_blank"
href="https://pikwizard.com/photo/neon-red-market-trend-line-with-social-media-engagement-callouts-on-green-data-grid/64a1ff7b66b45477a039e03918ff480a/"
style="text-decoration: none; font-size: 10px; margin: 0;"
>
<img src="https://pikwizard.com/pw/medium/64a1ff7b66b45477a039e03918ff480a.jpg" style="margin: 0; width: 100%;" alt="" />
<p style="font-size: 12px; margin: 0;">PikWizard</p>
</a>
</span>
</span>
Free (free of charge)
Free for personal and commercial use.
Author: Creative Art
Similar Free Stock Images

Premium


Premium


Premium


Premium


Premium


Premium


Premium


Premium


Premium


Premium


Premium


Premium


Premium


Premium


Premium


Premium


Premium


Premium


Premium


Premium


Premium


Premium


Premium


Premium


Premium