- Home >
- Stock Photos >
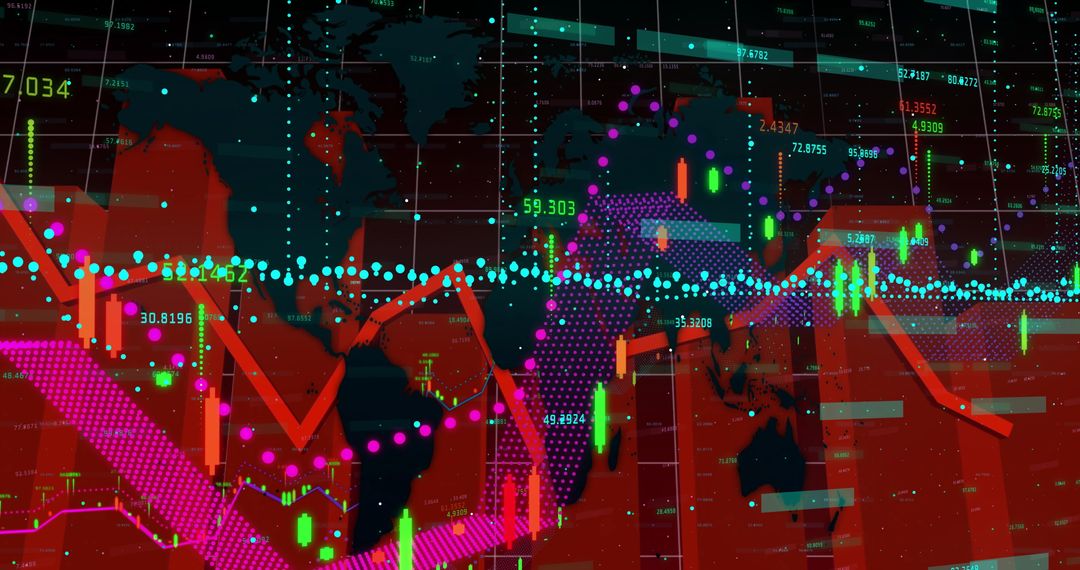
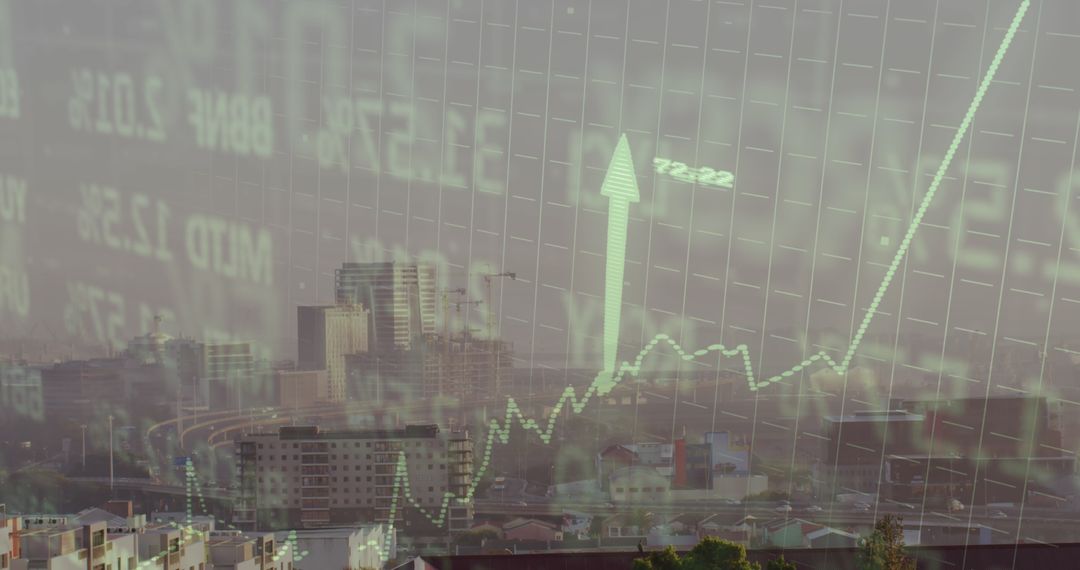
- Neon Red Stock Market Uptrend Chart with Striped Arrows and Data Visualization
Neon Red Stock Market Uptrend Chart with Striped Arrows and Data Visualization Image

Displaying neon red jagged line chart over dark grid, striped upward arrows and neon green geometric accents creating dramatic finance visualization. Conveying upward momentum and market volatility through sharp diagonal composition and high-contrast red/green palette. Illustrating stock surge, market analysis, trading performance or cryptocurrency rally for editorial and commercial use. Enhancing fintech websites, trading dashboards, investor presentations, blog headers, social media campaigns, annual reports and marketing materials. Working well as hero graphic, background for data-driven articles, slide deck cover or banner to communicate momentum, risk and opportunity.
Powered by 


0
downloads
downloads
Tags:
More
Credit Photo
If you would like to credit the Photo, here are some ways you can do so
Text Link
photo Link
<span class="text-link">
<span>
<a target="_blank" href=https://pikwizard.com/photo/neon-red-stock-market-uptrend-chart-with-striped-arrows-and-data-visualization/5793cd6da5a6826b3cd3cd35a839d472/>PikWizard</a>
</span>
</span>
<span class="image-link">
<span
style="margin: 0 0 20px 0; display: inline-block; vertical-align: middle; width: 100%;"
>
<a
target="_blank"
href="https://pikwizard.com/photo/neon-red-stock-market-uptrend-chart-with-striped-arrows-and-data-visualization/5793cd6da5a6826b3cd3cd35a839d472/"
style="text-decoration: none; font-size: 10px; margin: 0;"
>
<img src="https://pikwizard.com/pw/medium/5793cd6da5a6826b3cd3cd35a839d472.jpg" style="margin: 0; width: 100%;" alt="" />
<p style="font-size: 12px; margin: 0;">PikWizard</p>
</a>
</span>
</span>
Free (free of charge)
Free for personal and commercial use.
Author: Authentic Images
Similar Free Stock Images

Premium


Premium


Premium


Premium


Premium


Premium


Premium


Premium


Premium


Premium


Premium


Premium


Premium


Premium


Premium


Premium


Premium


Premium


Premium


Premium


Premium


Premium


Premium


Premium