- Home >
- Stock Photos >
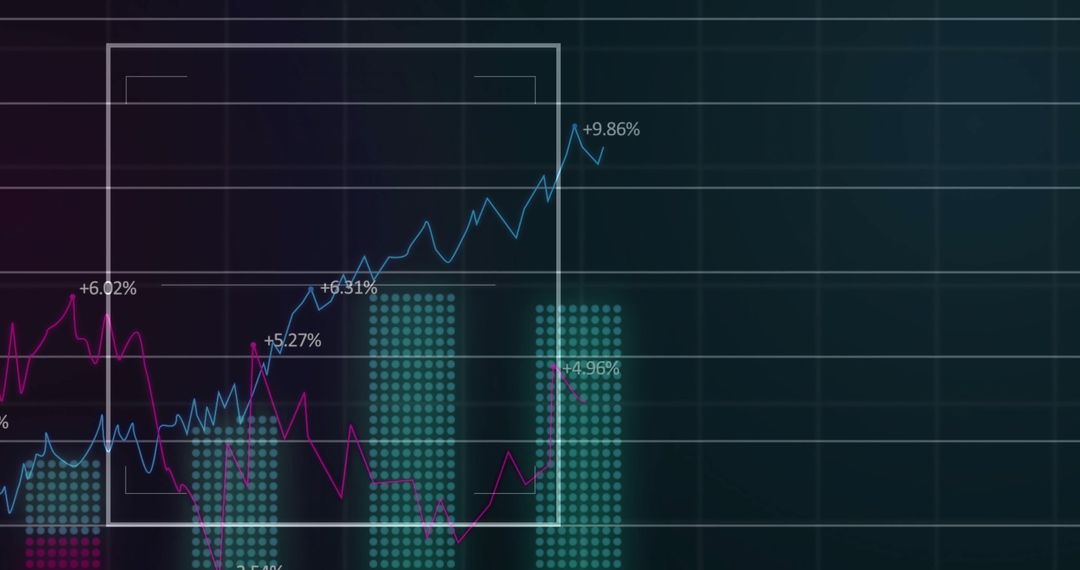
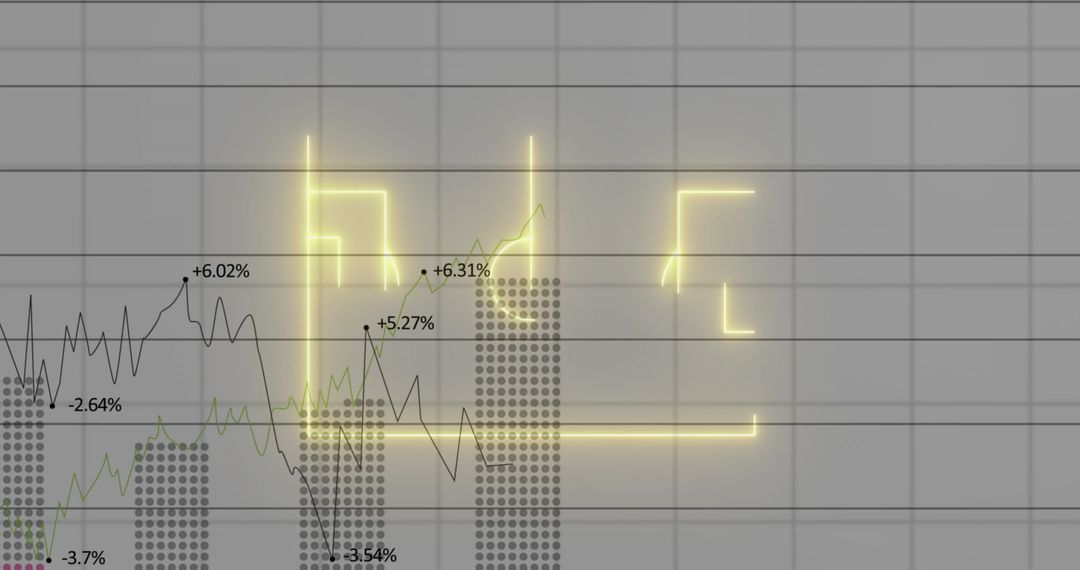
- Neon Soccer Field Overlaying Financial Dashboard Showing Red and Blue Performance Trends
Neon Soccer Field Overlaying Financial Dashboard Showing Red and Blue Performance Trends Image

Graphic showing neon yellow soccer pitch overlaying dark grid with red and blue trend lines and dotted bar elements. Composition combining sports iconography with financial chart elements to suggest sports analytics, betting trends, and sports finance. Artwork suiting website headers, editorial features, marketing campaigns, broadcast graphics, presentation slides, and social media posts. Color palette providing high contrast for overlaying text, logos, and data callouts. File working well for data-driven headlines, season previews, sponsorship decks, and infographics explaining player performance or market impact. Horizontal orientation making ideal for web banners, hero sections, and TV lower-thirds; cropping focusing on pitch center for banner use or expanding grid for full-bleed backgrounds.
Powered by  - Get 15% off with code: PIKWIZARD15


0
downloads
downloads
Tags:
More
Credit Photo
If you would like to credit the Photo, here are some ways you can do so
Text Link
photo Link
<span class="text-link">
<span>
<a target="_blank" href=https://pikwizard.com/photo/neon-soccer-field-overlaying-financial-dashboard-showing-red-and-blue-performance-trends/5e1dbfca398a48d6a66318ef8e9f9508/>PikWizard</a>
</span>
</span>
<span class="image-link">
<span
style="margin: 0 0 20px 0; display: inline-block; vertical-align: middle; width: 100%;"
>
<a
target="_blank"
href="https://pikwizard.com/photo/neon-soccer-field-overlaying-financial-dashboard-showing-red-and-blue-performance-trends/5e1dbfca398a48d6a66318ef8e9f9508/"
style="text-decoration: none; font-size: 10px; margin: 0;"
>
<img src="https://pikwizard.com/pw/medium/5e1dbfca398a48d6a66318ef8e9f9508.jpg" style="margin: 0; width: 100%;" alt="" />
<p style="font-size: 12px; margin: 0;">PikWizard</p>
</a>
</span>
</span>
Free (free of charge)
Free for personal and commercial use.
Author: Awesome Content
Similar Free Stock Images