1. Home > 
  2. Stock Photos > 
  3. Neon Stadium and Data Integration in Digital Interface

Neon Stadium and Data Integration in Digital Interface Image

Neon Stadium and Data Integration in Digital Interface

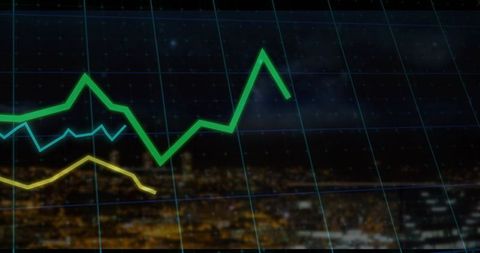
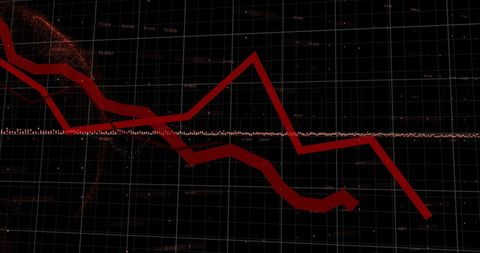
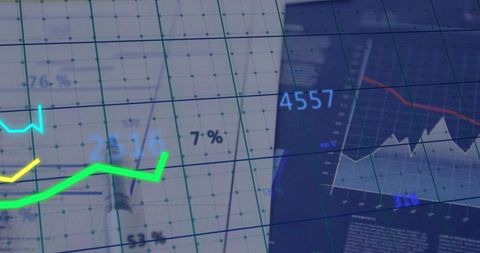
This image visually depicts a glowing neon structure resembling a stadium, integrated with dynamic data elements such as graphs, percentages, and numbers set against a black background. Perfect for use in presentations or digital publications concerning sports analytics, technology in sports, or futuristic data processing concepts. The composition conveys innovation and modern analytics, making it suitable for advertising cutting-edge sports technologies or data-driven sports solutions.

Powered by Adobe logo
Image of neon stadium over data processing on black background - Powered by AdobeDynamic AI neural network pulsates with glowing data streams in futuristic neon cyber arena - Powered by AdobeRadiant Multi-Tiered Server Box with Blue and Orange Neon Edges in Sleek Digital Arena for High-Performance Data Storage Cloud Technology Solutions - Powered by AdobeVivid digital cyber board Glowing energy blocks Shining empty space Magic neon forms Shape of light Led platform on arena Colorful dynamic lines Fantasy ui Glint bright scene Futuristic hud - Powered by AdobeDark room lit by led lights man sitting in front of computer wearing sweatshirt and yellow cap headset. Music producer's studio rapper processing tracks satisfied with his work clenches fist with joy - Powered by Adobe

Credit Photo

If you would like to credit the Photo, here are some ways you can do so

Free (free of charge)

Free for personal and commercial use.

Author: People Creations

Similar Free Stock Images

Red Declining Graph on Digital Grid Display Represents Falling Markets
Premium
Image of purple neon scanner processing data over hand holding medal in floodlit sports stadium
Financial Data Analysis with Digital Grid Chart
Financial Trends with Power Line Graphic Overlay
Digital Fuel Sales Analysis with Graphical Data Interface
Fluctuating Graph on Green Grid Background Illustrating Financial Trends
Dynamic Stock Market Data Visualization on Digital Screen
Dynamic Stock Market Data Amid Empty Office Setting
Rising Graphs and Interactive Financial Data Analytics Background
Abstract Financial Graphs with Rising Trends and Positive Indicators
Data Analysis and Cybersecurity Concept Art
Dynamic Analysis of Stock Market Trends and Patterns
Dynamic Data Chart on Dark Digital Background
Financial Graphs Overlay Virtual Data Office Computers
Dynamic Red Line Graph on Digital Black Grid Background
Dynamic Financial Graph with Growth Patterns on Digital Screen
Inflation Analytics: Graphic Representation of Stock Market Trends
Digital Data Analytics on Blue Grid Background
Green Graph Showing Forex Trends on Transparent Cyber Interface
Colorful Financial Graphs on Digital Grid Background
Financial Data Analysis with Declining Trend on Blueprint Graph
Digital Decline Graphic with QR Code Elements and Red Line
Green Line Graph Displaying Financial Market Trends on Digital Screen
Fluctuating Line Graph with Digital Interface Over Grid
Futuristic Digital Dashboard with Neon Line Charts Analysis
Falling Market Trend with Empty Classroom Background
Financial Data Analysis with Vibrant Lines on Blue Background
Premium
Image of neon stadium over data processing on black background
World Map with Falling Line Graphs Indicating Global Economic Decline
Digital Dashboard Showing Financial Analysis with Graphs
Abstract Financial Graph on Dark Digital Background
Dynamic Graphs Over Solar Panels and Storage Battery Concept
Cryptocurrency Growth Chart Over Digital World Map
Rising Green Line Chart Overlays Concept of Financial Growth
Digital Stock Market Green Graph Against Dark Trading Board
Financial Market Chart on Digital Screen Showing Growing Trends
Dynamic Data Visualization with Financial Charts and 3D Elements
Dynamic Financial Data Representation on Digital Grid
Financial Data Graph Overlay on Modern Office Background
Data Analytics and Business Strategy Network Interface
Financial Data with Fluctuating Graph Lines on Grid Background
Colorful Line Graphs Depicting Fluctuating Financial Trends
Dynamic Red Line Graph Over Green Grid Background
Green Line Graph Depicting Sustainability and Environmental Icons
Digital Data Streaming Over Planet Earth
Financial Graph with Data Analysis and Market Statistics
Armenian Flag with Financial Graph Overlay Depicting Market Trends
Digital Dashboard with Colorful Data Visualization
Bright Green Trend Line on Futuristic Trading Screen
Financial Data Visualization with Declining Red Arrow
Declining Financial Graph on Dark Screen Amid Data Points
Dynamic Financial Market Trends with Data Visualizations
Financial Data Visualization with Rising Trends
Premium
Image of neon scanner processing data over american football player holding ball
Financial Data on USA Flag Background Symbolizing Economics
Dynamic Financial Graph with Transparency Effect Overlay
Green Line Rising on Digital Trading Board with Abstract Background
Social Media Activity Icons on Digital Graph
Dynamic Financial Data Chart Display with Graphical Analysis
Financial Graphs Displaying Business Trends on Grid Background
Financial Data Analysis with Mathematical Equations Overlay
Dynamic Financial Growth Graph on Blue Grid Background
Analyzing Financial Charts on Digital Screen
Financial Data Overlay on Office Computers
Dynamic Stock Market Visual in Modern Office Setting
Dynamic Data Visualization with Virtual Graphs and Numbers
Colorful Line Graphs Displaying Data Over City Skyline
Digital Stock Market Graph with Abstract Coding Background
Global Financial Graph Showing Decline Indicating Recession
Digital Interface with Overlapping Code and Graph
Dynamic Financial Data with Fluctuating Graph Lines
Fluctuating Stock Market Graph with Dramatic Peaks
Colorful Financial Data Charts on Digital Grid Background
Dynamic Data Visualization with Neon Line Graphs Against Cityscape
Futuristic Digital DNA Helix on Abstract Grid Background
Dynamic Graph with Vibrant Lines on Black Background
Analyzing Graph Showing Market Economy Stock Crisis
Financial Graph and Cityscape Analysis with Technological Overlay
Global Economic Trends Highlighted on World Map with Graphs
Futuristic Financial Graphs with Dynamic Green Line
Analyzing Financial Graphs with Colorful Chart Lines
Digital Financial Data Charts and Statistics Analysis
Financial Market Growth Over City Skyline
Dynamic Digital Market Analysis with Holographic Data
Digital Lock with Real-Time Data Display
Dynamic Forex Trading Graphs with Increasing Numbers
Red Line Graph Showing Downward Trend on Black Grid Background
Neon Stadium with Data Graphics on Dark Background
Red Financial Graph Indicates Declining Market Trends
Declining Stock Market Graph on Digital Grid Background
Dynamic Global Data Insights with Trend Lines
Dynamic Financial Data Graphed Over Digital Grid
Dynamic Red Line Graph With Data Points on Gridded Background
Abstract Financial Graph Displayed on Office Monitor
Fluctuating Financial Graph on Green Grid Background
Stock Market Decline Data Analysis on Dark Grid Background
Dynamic Stock Market Analysis with Digital Graph Lines
Colorful Financial Chart with Heart Icons on Blue Background
Red Trend Line Fluctuating on Digital Chart Grid
Neon Line Graphs on Dynamic Data Dashboard for Analytics