- Home >
- Stock Photos >
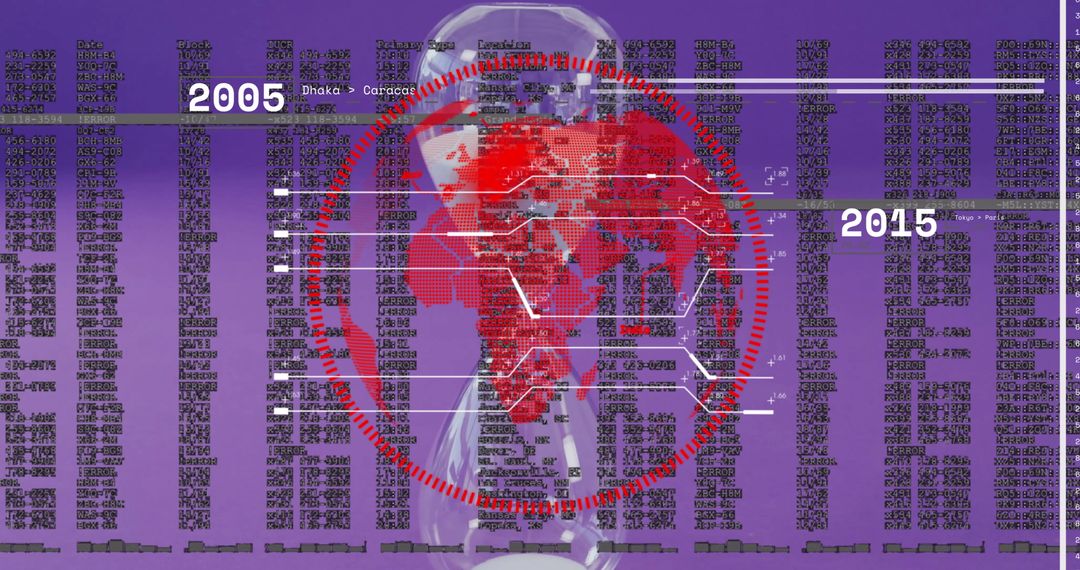
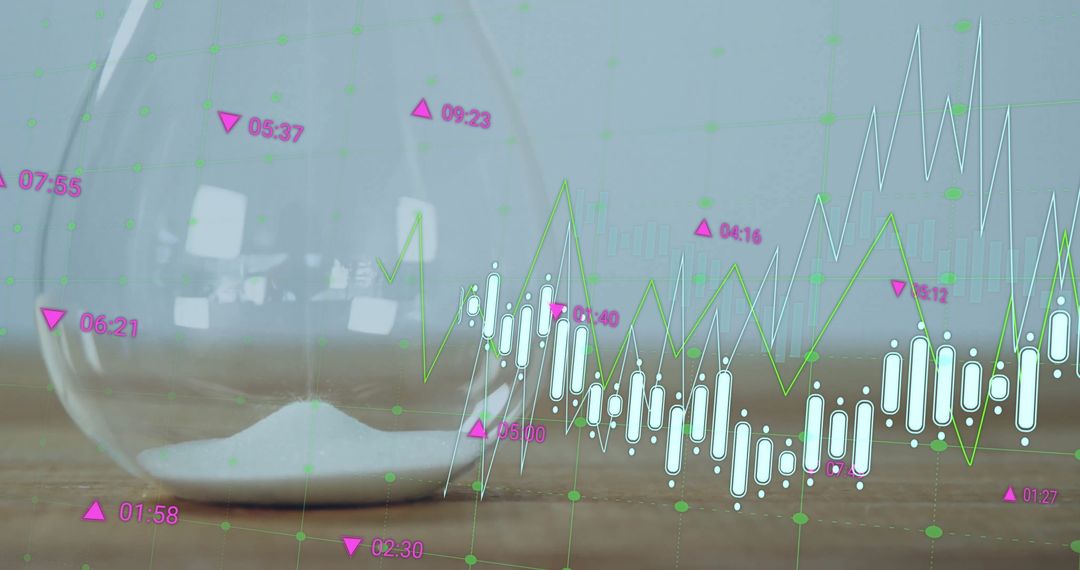
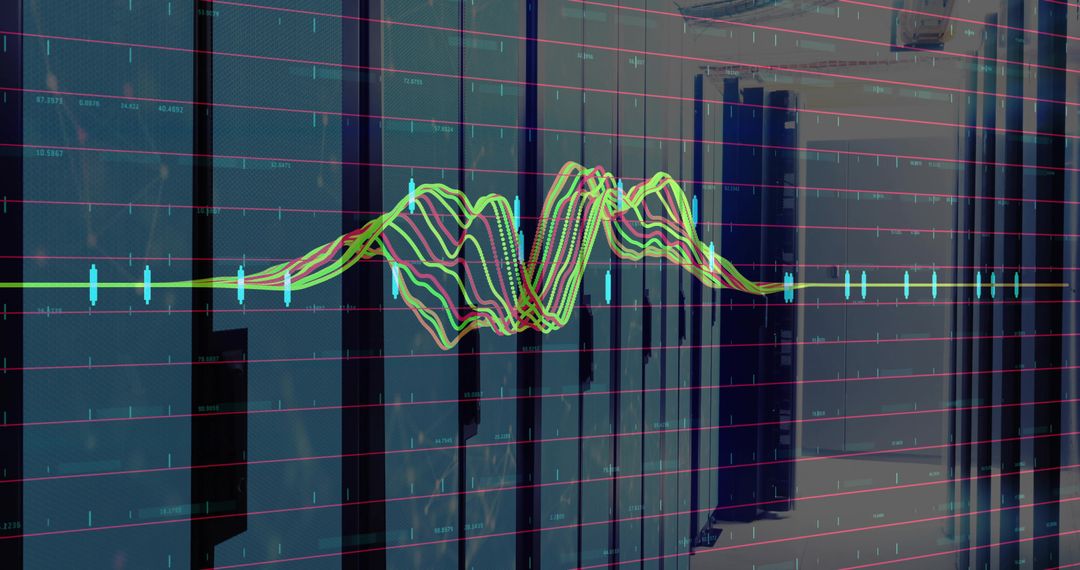
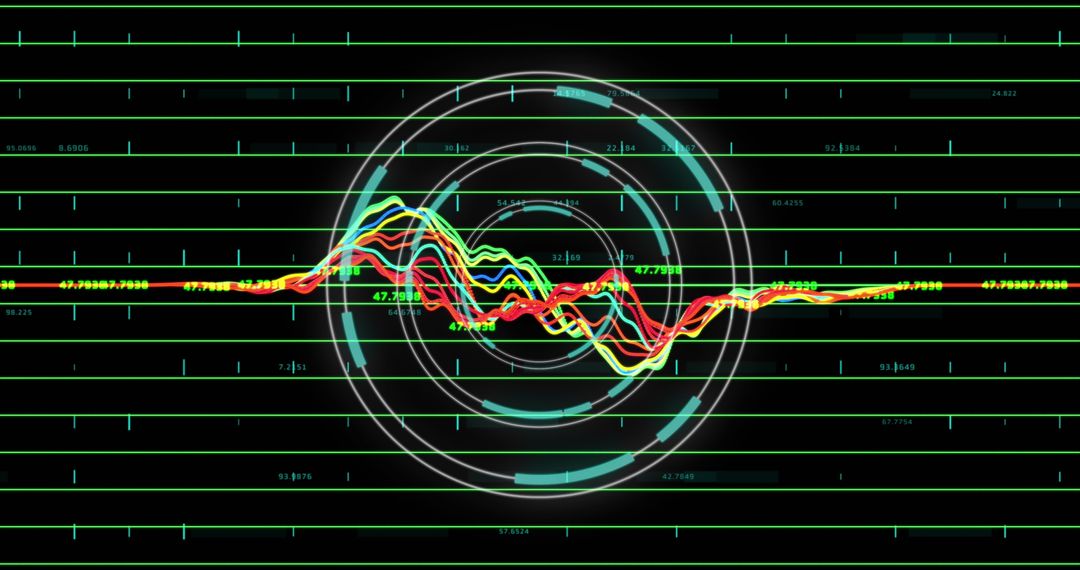
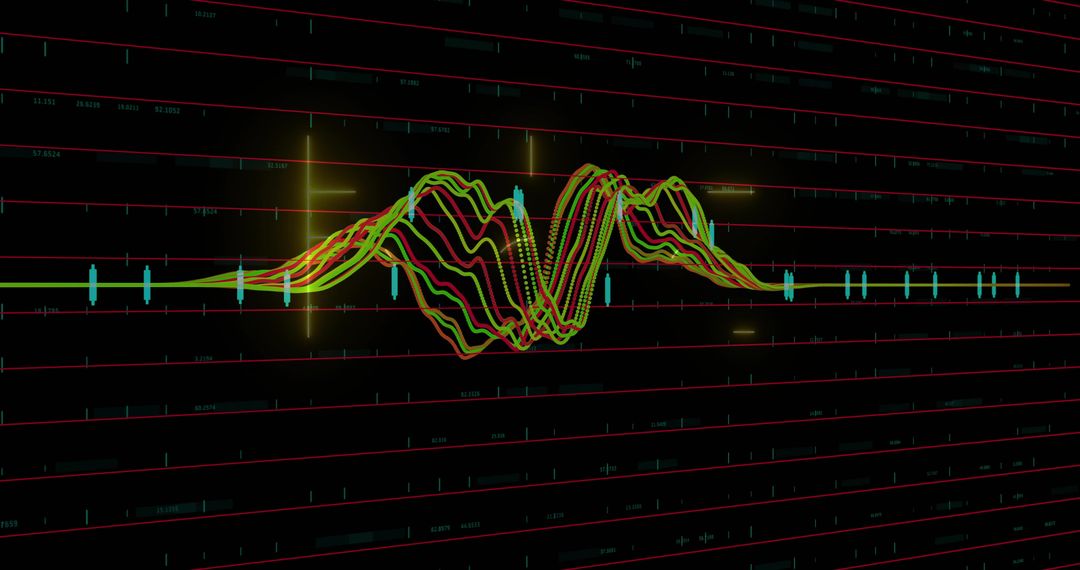
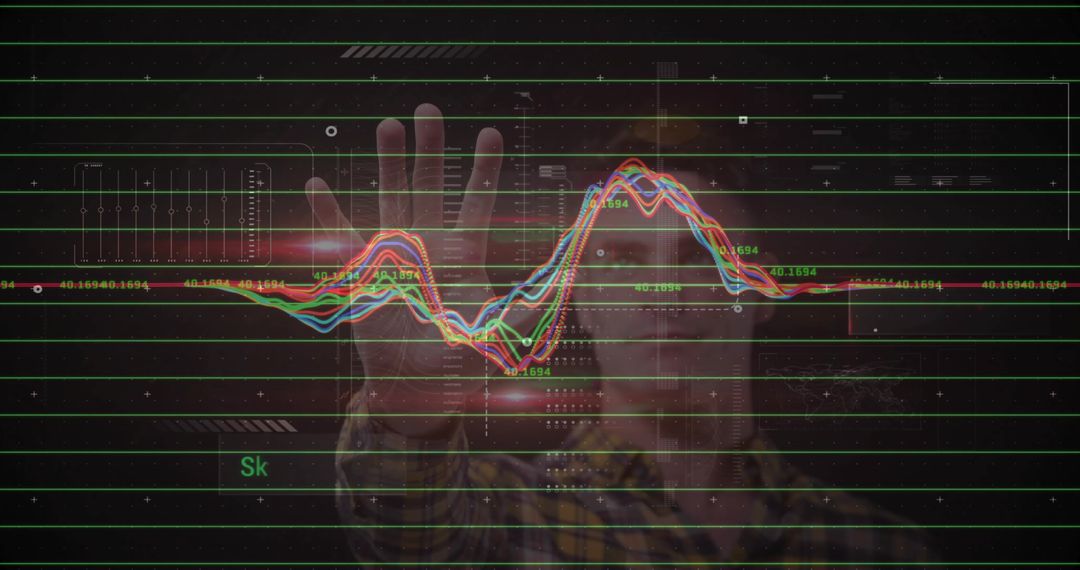
- Neon waveform crossing glowing hourglass on dark grid dashboard for time analytics
Neon waveform crossing glowing hourglass on dark grid dashboard for time analytics Image
Dark UI showing neon waveform intersecting glowing hourglass over horizontal gridlines and numeric labels. Multiple colored lines representing dataset trends, volatility, and temporal shifts. Visual suggesting time-sensitive analytics, deadline pressure, data decay, or temporal correlation. High contrast neon palette with teal, magenta, and yellow accents on deep charcoal background. Centered hourglass silhouette balancing right side while waveform flows across center. Useful for website headers, report covers, presentation slides, blog posts, social media visuals, and marketing campaigns related to data science, fintech, time management, cybersecurity, and network monitoring. Designers and content creators pairing bold typography and minimal layout for hero banners and feature sections. Presenting as metaphor for deadline-driven projects, performance analysis, real-time monitoring, or predictive analytics. Cropping or masking to create header or background variations; recoloring overlays to match brand palette and maintain cohesive design.
Powered by  - Get 15% off with code: PIKWIZARD15


0
downloads
downloads
Tags:
More
Credit Photo
If you would like to credit the Photo, here are some ways you can do so
Text Link
photo Link
<span class="text-link">
<span>
<a target="_blank" href=https://pikwizard.com/photo/neon-waveform-crossing-glowing-hourglass-on-dark-grid-dashboard-for-time-analytics/35192005b3f348a675528b88c21e4a3b/>PikWizard</a>
</span>
</span>
<span class="image-link">
<span
style="margin: 0 0 20px 0; display: inline-block; vertical-align: middle; width: 100%;"
>
<a
target="_blank"
href="https://pikwizard.com/photo/neon-waveform-crossing-glowing-hourglass-on-dark-grid-dashboard-for-time-analytics/35192005b3f348a675528b88c21e4a3b/"
style="text-decoration: none; font-size: 10px; margin: 0;"
>
<img src="https://pikwizard.com/pw/medium/35192005b3f348a675528b88c21e4a3b.jpg" style="margin: 0; width: 100%;" alt="" />
<p style="font-size: 12px; margin: 0;">PikWizard</p>
</a>
</span>
</span>
Free (free of charge)
Free for personal and commercial use.
Author: Creative Art
Similar Free Stock Images