
- Home >
- Stock Photos >
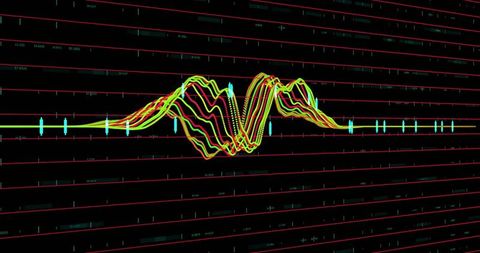
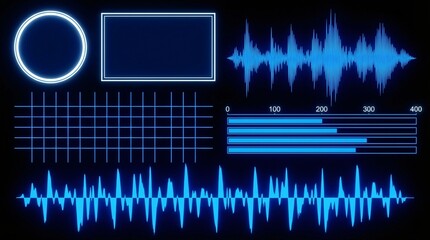
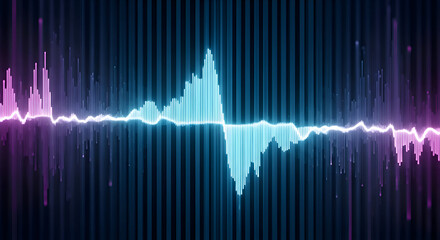
- Neon Waveform Pulse on Digital Dashboard Display
Neon Waveform Pulse on Digital Dashboard Display Image
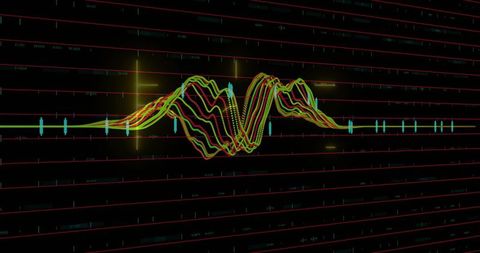
Neon waveform fluently depicting fluctuating data signals against a backdrop of intersecting red grid lines offers a sleek representation of digital analysis and futuristic data trends. Prominent usage among tech enthusiasts, data analysts, and for educational purposes to illustrate fluctuating data metrics and analytical processes, this can effectively serve in tutorials, blogs, digital marketing, or sci-fi themed discussions.
Powered by 


downloads
Tags:
More
Credit Photo
If you would like to credit the Photo, here are some ways you can do so
Text Link
photo Link
<span class="text-link">
<span>
<a target="_blank" href=https://pikwizard.com/photo/neon-waveform-pulse-on-digital-dashboard-display/edcdf298c2b665299a2baffaf8ea6a2e/>PikWizard</a>
</span>
</span>
<span class="image-link">
<span
style="margin: 0 0 20px 0; display: inline-block; vertical-align: middle; width: 100%;"
>
<a
target="_blank"
href="https://pikwizard.com/photo/neon-waveform-pulse-on-digital-dashboard-display/edcdf298c2b665299a2baffaf8ea6a2e/"
style="text-decoration: none; font-size: 10px; margin: 0;"
>
<img src="https://pikwizard.com/pw/medium/edcdf298c2b665299a2baffaf8ea6a2e.jpg" style="margin: 0; width: 100%;" alt="" />
<p style="font-size: 12px; margin: 0;">PikWizard</p>
</a>
</span>
</span>
Free (free of charge)
Free for personal and commercial use.
Author: People Creations
Similar Free Stock Images

Premium


Premium


Premium


Premium


Premium


Premium

Premium


Premium
Premium


Premium


Premium


Premium


Premium


Premium


Premium

Premium


Premium


Premium


Premium


AI

Premium

Premium

Premium


Premium


Premium


Premium


Explore More Free Stock Images