
- Home >
- Free Stock Photos & Images >
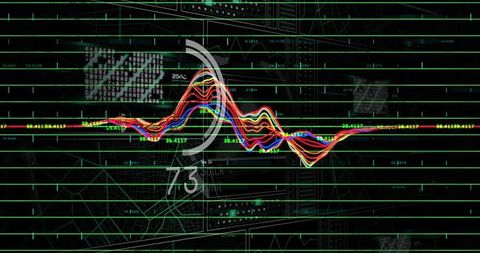
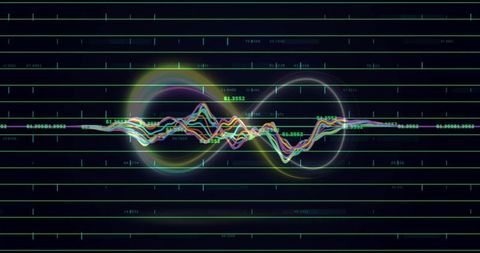
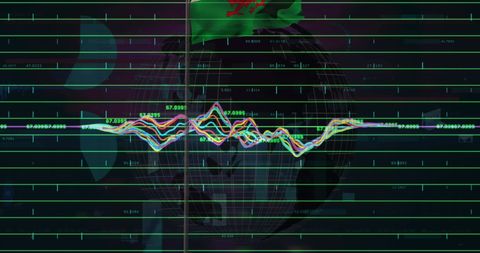
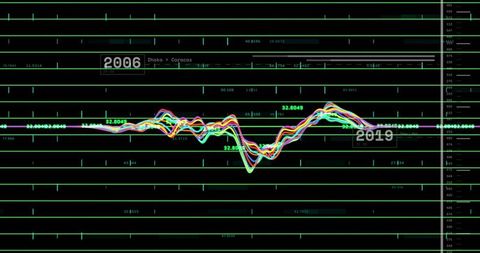
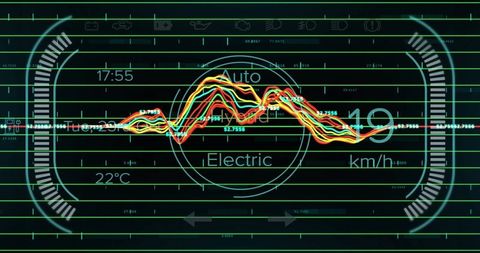
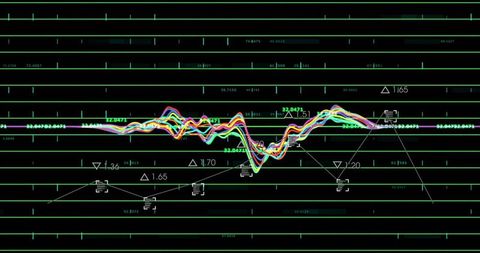
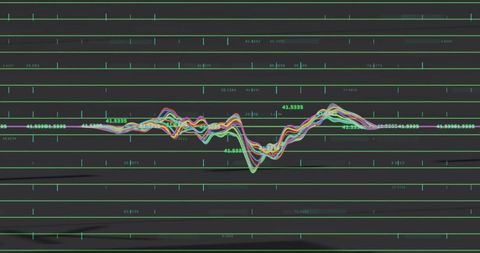
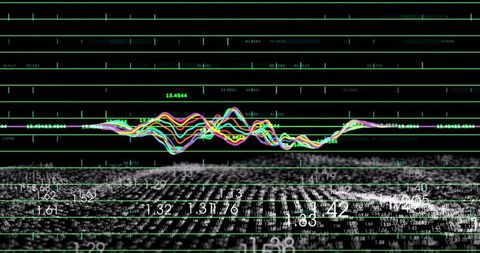
- Neon Waveform Visualizing Futuristic HUD Telemetry Dashboard with Grid and Numeric Labels
Neon Waveform Visualizing Futuristic HUD Telemetry Dashboard with Grid and Numeric Labels Free Stock Image

Neon waveform graphic centering on horizontal green grid with numeric labels and translucent HUD overlays. Multicolor signal traces overlapping along center axis, showing oscillation, frequency spikes, glowing markers, and subtle alphanumeric readouts. Dark background enhancing neon glow and conveying futuristic, high-tech atmosphere. Suggested uses: technology articles, fintech dashboards, cybersecurity presentations, data analytics reports, audio production materials, UI concept mockups, marketing banners, website hero backgrounds, broadcast graphics, streaming overlays. Pairing with bold sans-serif headlines and minimal text to emphasize dynamic data energy. Suitable for print, web, slide decks, product demos, app interfaces.
Powered by  - Get 15% off with code: PIKWIZARD15


downloads
Tags:
More
Credit Photo
If you would like to credit the Photo, here are some ways you can do so
Text Link
photo Link
<span class="text-link">
<span>
<a target="_blank" href=https://pikwizard.com/photo/neon-waveform-visualizing-futuristic-hud-telemetry-dashboard-with-grid-and-numeric-labels/d6bcd68d7fa5e658d3b267f037edd9e1/>PikWizard</a>
</span>
</span>
<span class="image-link">
<span
style="margin: 0 0 20px 0; display: inline-block; vertical-align: middle; width: 100%;"
>
<a
target="_blank"
href="https://pikwizard.com/photo/neon-waveform-visualizing-futuristic-hud-telemetry-dashboard-with-grid-and-numeric-labels/d6bcd68d7fa5e658d3b267f037edd9e1/"
style="text-decoration: none; font-size: 10px; margin: 0;"
>
<img src="https://thumbs.wbm.im/pw/medium/d6bcd68d7fa5e658d3b267f037edd9e1.jpg" style="margin: 0; width: 100%;" alt="Neon Waveform Visualizing Futuristic HUD Telemetry Dashboard with Grid and Numeric Labels" />
<p style="font-size: 12px; margin: 0;">PikWizard</p>
</a>
</span>
</span>
Free (free of charge)
Free for personal and commercial use.
Author: Awesome Content
Similar Free Stock Images


Premium


Premium


Premium


Premium


Premium


Premium


Premium


Premium


Premium


Premium


Premium


Premium


Premium


Premium


Premium


Premium


Premium


Premium


Premium


Premium


Premium


Premium


Explore More Free Stock Images