- Home >
- Stock Photos >
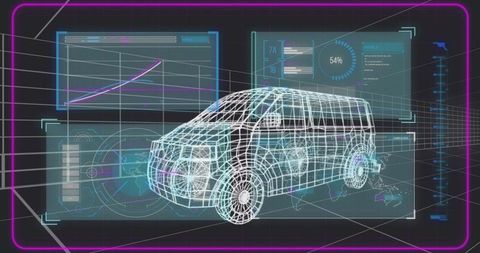
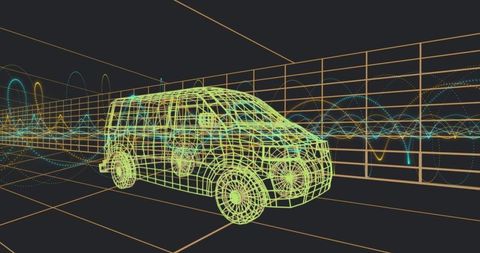
- Neon Wireframe Van 3D Data Visualization with Grid and Waveform Simulation
Neon Wireframe Van 3D Data Visualization with Grid and Waveform Simulation Image

Rendering neon-green wireframe van within dark grid plane, accented by cyan and yellow waveform trails for dynamic tech aesthetic. Visualizing vehicle design, sensor mapping, signal analysis and virtual testing workflows. Serving well for technology presentations, automotive design portfolios, startup pitch decks, website hero headers, editorial illustrations about autonomous driving and telematics. Providing bold focal point for banner graphics, slide backgrounds, social media posts and print collateral. Offering ample negative space for overlaying text, logos and interface elements. Complementing data-driven branding, UX mockups, infographics and motion graphics projects.

downloads
Credit Photo
If you would like to credit the Photo, here are some ways you can do so
Free (free of charge)
Free for personal and commercial use.
Author: People Creations