- Home >
- Stock Photos >
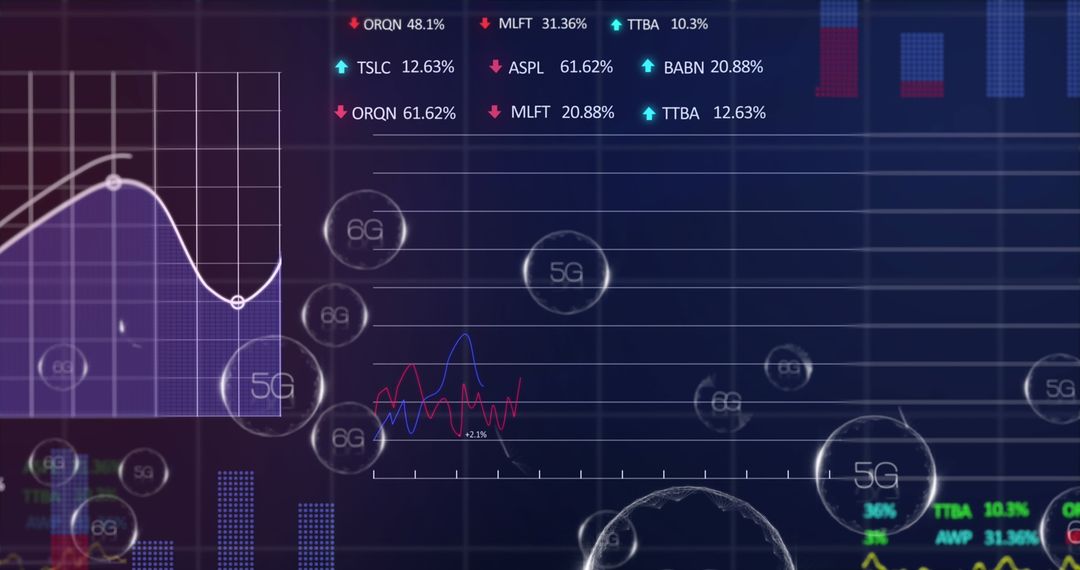
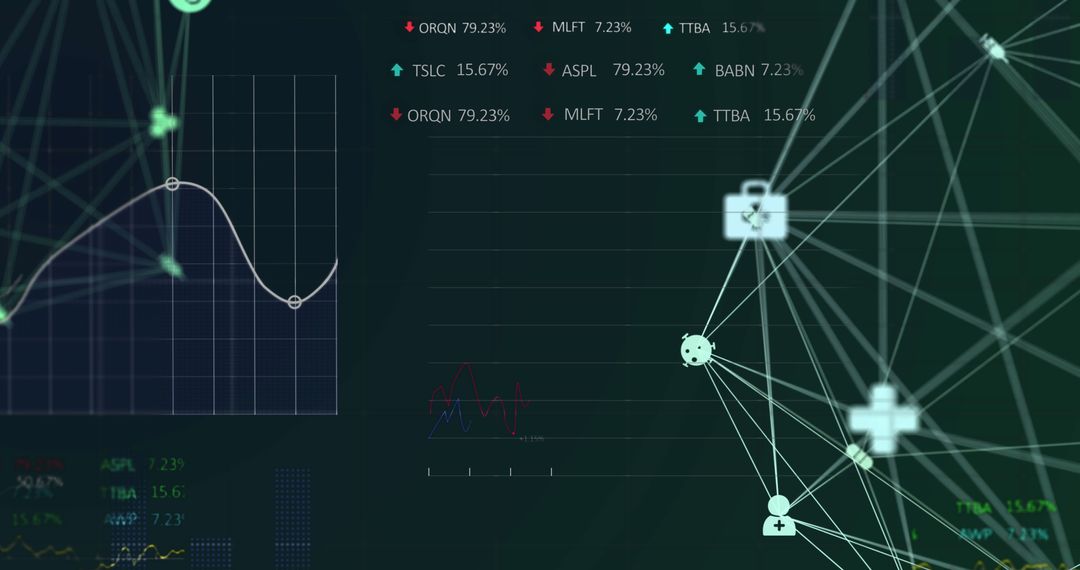
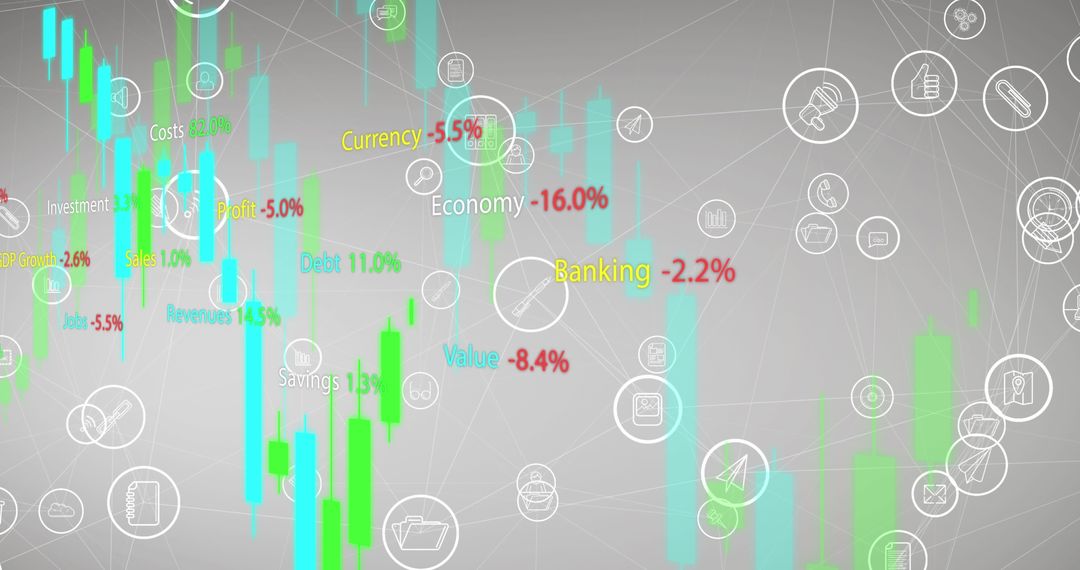
- Network Flowchart Overlapping Stock Market Data and Charts
Network Flowchart Overlapping Stock Market Data and Charts Image

Depiction of interconnected network flowchart with symbolic user icons overlapping various trading boards and graphs. Suitable for illustrating complex business relationships, stock market analysis, digital communication networks, or any data-driven report visuals. Useful for websites, presentations, or reports targeting finance, business intelligence, or investment fields.
Powered by 


4
downloads
downloads
Tags:
More
Credit Photo
If you would like to credit the Photo, here are some ways you can do so
Text Link
photo Link
<span class="text-link">
<span>
<a target="_blank" href=https://pikwizard.com/photo/network-flowchart-overlapping-stock-market-data-and-charts/5454f92afef182d9d09b39ea3d5a45da/>PikWizard</a>
</span>
</span>
<span class="image-link">
<span
style="margin: 0 0 20px 0; display: inline-block; vertical-align: middle; width: 100%;"
>
<a
target="_blank"
href="https://pikwizard.com/photo/network-flowchart-overlapping-stock-market-data-and-charts/5454f92afef182d9d09b39ea3d5a45da/"
style="text-decoration: none; font-size: 10px; margin: 0;"
>
<img src="https://pikwizard.com/pw/medium/5454f92afef182d9d09b39ea3d5a45da.jpg" style="margin: 0; width: 100%;" alt="" />
<p style="font-size: 12px; margin: 0;">PikWizard</p>
</a>
</span>
</span>
Free (free of charge)
Free for personal and commercial use.
Author: People Creations
Similar Free Stock Images

Premium


Premium


Premium


Premium


Premium


Premium


Premium


Premium


Premium


Premium


Premium


Premium


Premium


Premium


Premium


Premium


Premium


Premium


Premium


Premium


Premium


Premium


Premium


Premium