
- Home >
- Stock Photos >
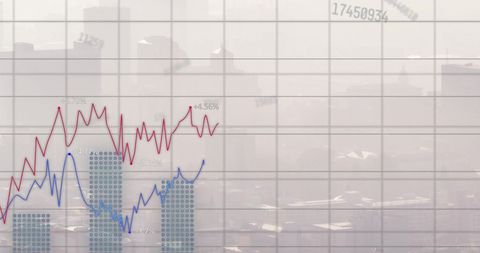
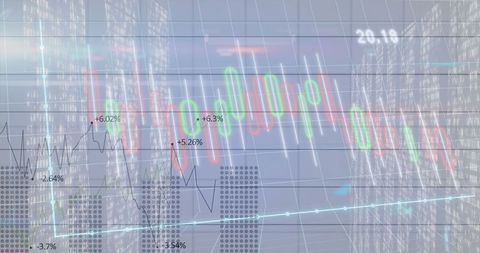
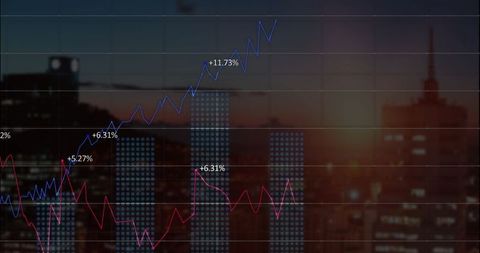
- Next-Level Financial Data Visualization With Bars and Lines
Next-Level Financial Data Visualization With Bars and Lines Image
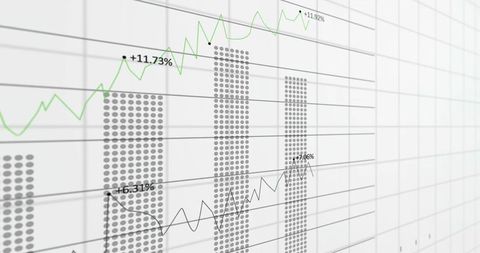
Abstract backdrop shows detailed financial analytics. Dotted bar chart combined with dual line graphs illustrate complex data relationships. Perfect for illustrating economic trends or depicting data-driven presentations in business sectors like finance, technology, and market research. Also suitable for modern presentation design, infographics, and business reports.
Powered by 


downloads
Tags:
More
Credit Photo
If you would like to credit the Photo, here are some ways you can do so
Text Link
photo Link
<span class="text-link">
<span>
<a target="_blank" href=https://pikwizard.com/photo/next-level-financial-data-visualization-with-bars-and-lines/dea21cdb64a0d6204e541e01f4c31231/>PikWizard</a>
</span>
</span>
<span class="image-link">
<span
style="margin: 0 0 20px 0; display: inline-block; vertical-align: middle; width: 100%;"
>
<a
target="_blank"
href="https://pikwizard.com/photo/next-level-financial-data-visualization-with-bars-and-lines/dea21cdb64a0d6204e541e01f4c31231/"
style="text-decoration: none; font-size: 10px; margin: 0;"
>
<img src="https://pikwizard.com/pw/medium/dea21cdb64a0d6204e541e01f4c31231.jpg" style="margin: 0; width: 100%;" alt="" />
<p style="font-size: 12px; margin: 0;">PikWizard</p>
</a>
</span>
</span>
Free (free of charge)
Free for personal and commercial use.
Author: Creative Art
Similar Free Stock Images

Premium


Premium


Premium


Premium


Premium


Premium


Premium
Premium


Premium


Premium


Premium


Premium


Premium


Premium


Premium


Premium


Premium


Premium


Premium


Premium


Premium


Premium


Premium


Premium


Premium

Explore More Free Stock Images