- Home >
- Stock Photos >
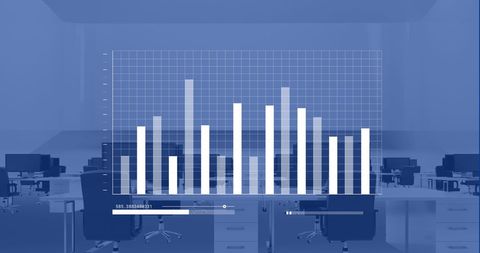
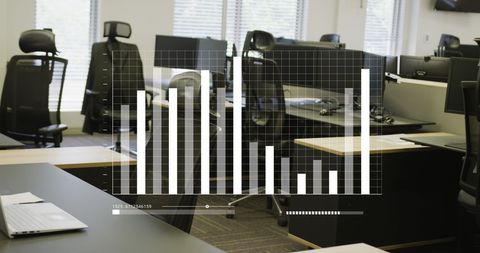
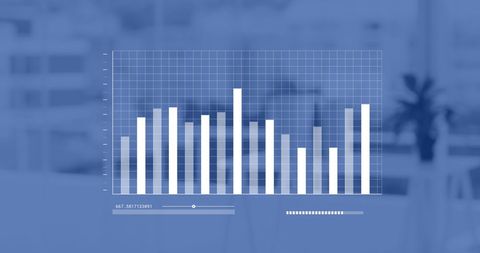
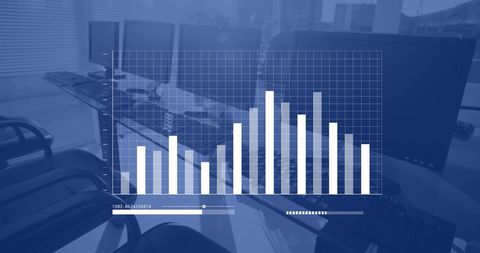
- Office Analytics Displaying Graph and Data Interface
Office Analytics Displaying Graph and Data Interface Image

Graph overlaid on office scene represents real-time business analytics and statistical data processing concepts used for business strategy, financial forecasting, or performance tracking. Suitable for presentations, articles on tech interfaces, data science visuals, or print media focussing on business innovation.

downloads
Tags:
More
Credit Photo
If you would like to credit the Photo, here are some ways you can do so
Text Link
photo Link
<span class="text-link">
<span>
<a target="_blank" href=https://pikwizard.com/photo/office-analytics-displaying-graph-and-data-interface/540dac4507428571189ea41a8fc83e3f/>PikWizard</a>
</span>
</span>
<span class="image-link">
<span
style="margin: 0 0 20px 0; display: inline-block; vertical-align: middle; width: 100%;"
>
<a
target="_blank"
href="https://pikwizard.com/photo/office-analytics-displaying-graph-and-data-interface/540dac4507428571189ea41a8fc83e3f/"
style="text-decoration: none; font-size: 10px; margin: 0;"
>
<img src="https://pikwizard.com/pw/medium/540dac4507428571189ea41a8fc83e3f.jpg" style="margin: 0; width: 100%;" alt="" />
<p style="font-size: 12px; margin: 0;">PikWizard</p>
</a>
</span>
</span>
Free (free of charge)
Free for personal and commercial use.
Author: Authentic Images