- Home >
- Stock Photos >
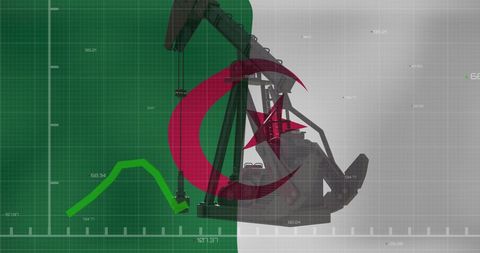
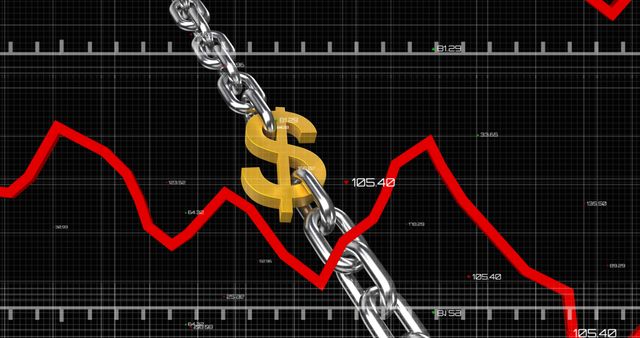
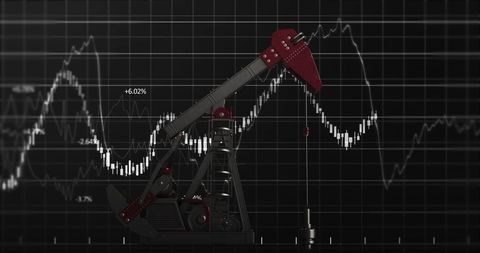
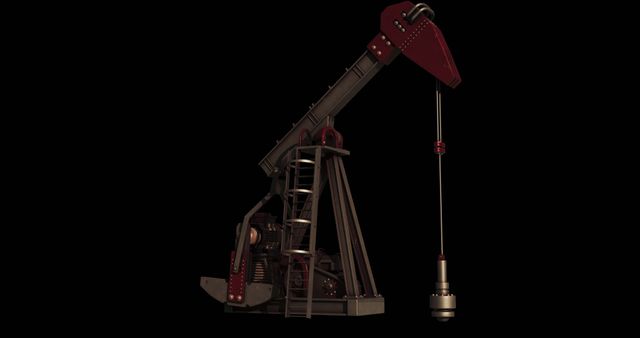
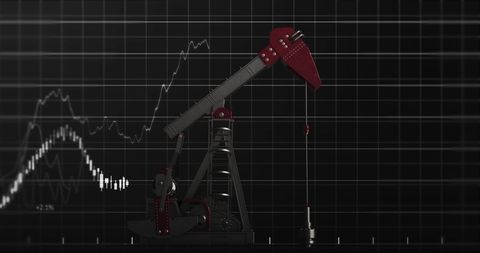
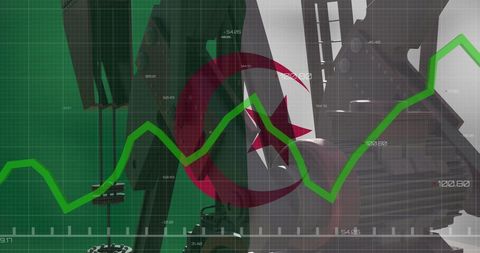
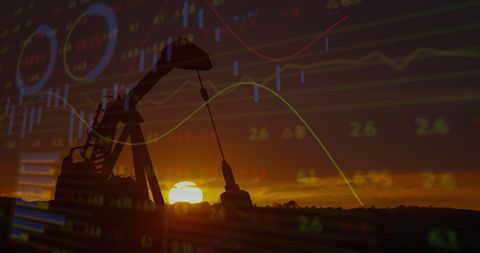
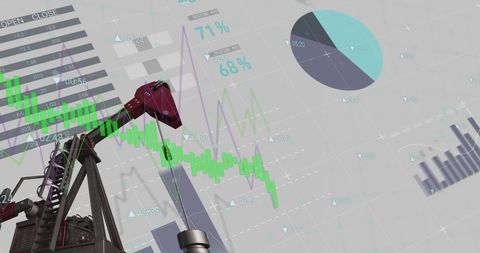
- Oil Pump Extracting with Digital Financial Chart in Background
Oil Pump Extracting with Digital Financial Chart in Background Image
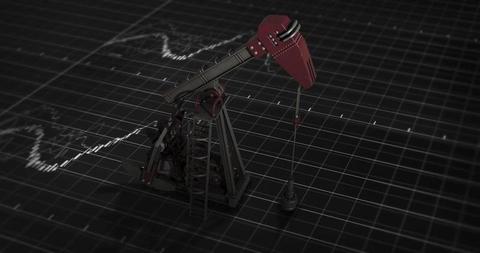
This composition marries the mechanical presence of an oil pump with digital financial charting. It is highly suitable for resources highlighting fluctuations or dynamics in the energy market. The dark grid background hints at both technological precision and a global economic framework. Utilize this to communicate complex themes of economic influence of energy sectors, investment prospects, or market analytics.
Powered by  - Get 15% off with code: PIKWIZARD15


2
downloads
downloads
Tags:
More
Credit Photo
If you would like to credit the Photo, here are some ways you can do so
Text Link
photo Link
<span class="text-link">
<span>
<a target="_blank" href=https://pikwizard.com/photo/oil-pump-extracting-with-digital-financial-chart-in-background/0bbbc322d7db6fa2e23028797eebad79/>PikWizard</a>
</span>
</span>
<span class="image-link">
<span
style="margin: 0 0 20px 0; display: inline-block; vertical-align: middle; width: 100%;"
>
<a
target="_blank"
href="https://pikwizard.com/photo/oil-pump-extracting-with-digital-financial-chart-in-background/0bbbc322d7db6fa2e23028797eebad79/"
style="text-decoration: none; font-size: 10px; margin: 0;"
>
<img src="https://pikwizard.com/pw/medium/0bbbc322d7db6fa2e23028797eebad79.jpg" style="margin: 0; width: 100%;" alt="" />
<p style="font-size: 12px; margin: 0;">PikWizard</p>
</a>
</span>
</span>
Free (free of charge)
Free for personal and commercial use.
Author: Authentic Images
Similar Free Stock Images
Loading...

Premium

Premium

Premium


Premium

Premium


Premium


Premium


Premium


Premium


Premium

Premium


Premium

Premium


Premium


Premium


Premium


Premium


Premium


Premium

Premium

Premium

Premium


Premium


Premium


Premium