- Home >
- Stock Photos >
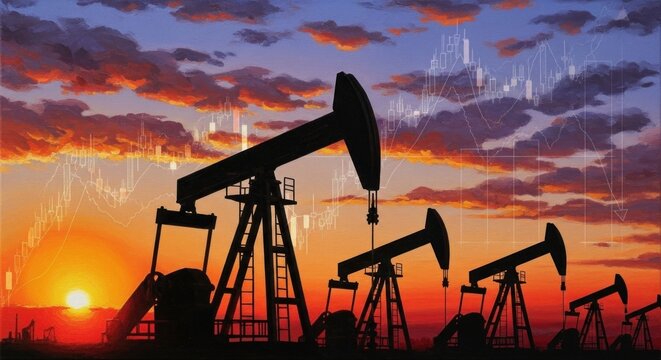
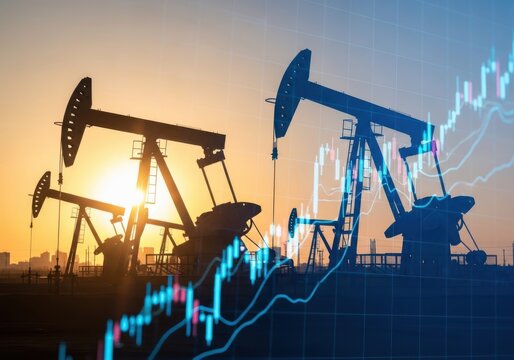
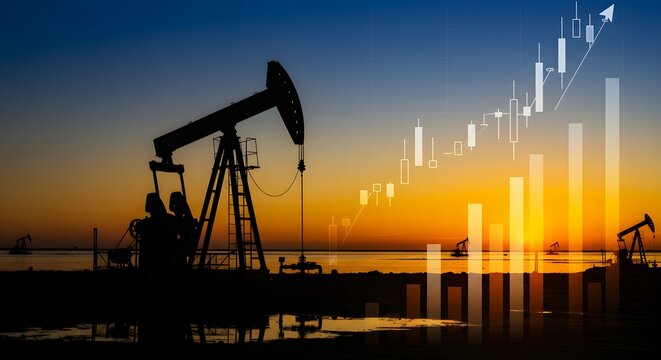
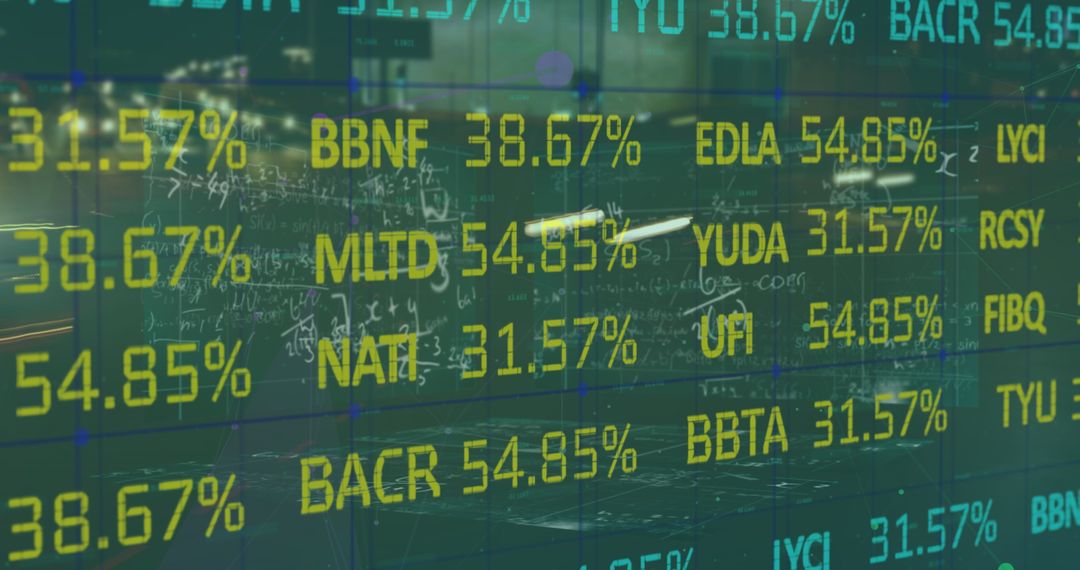
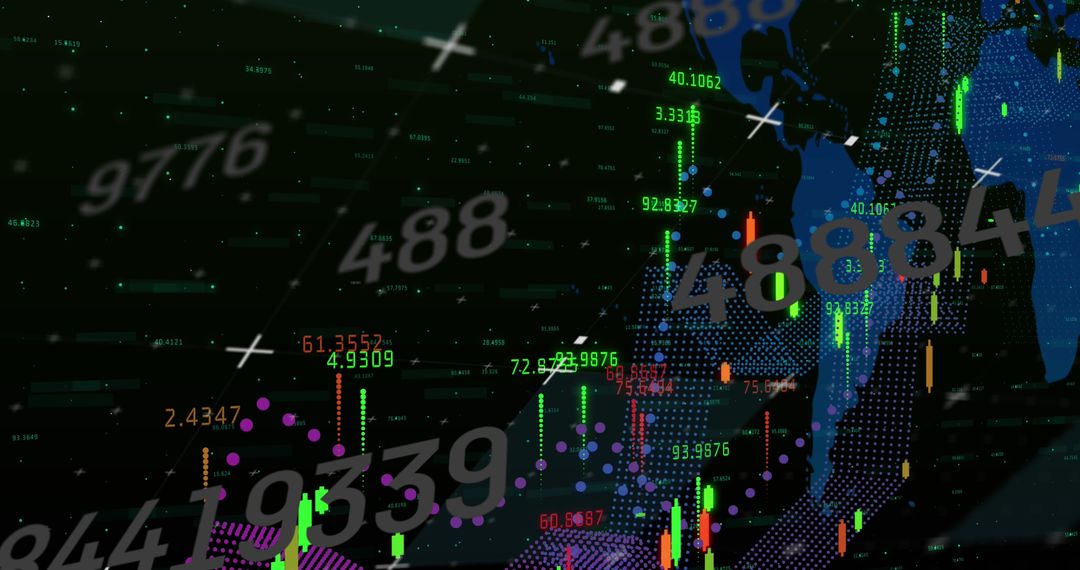
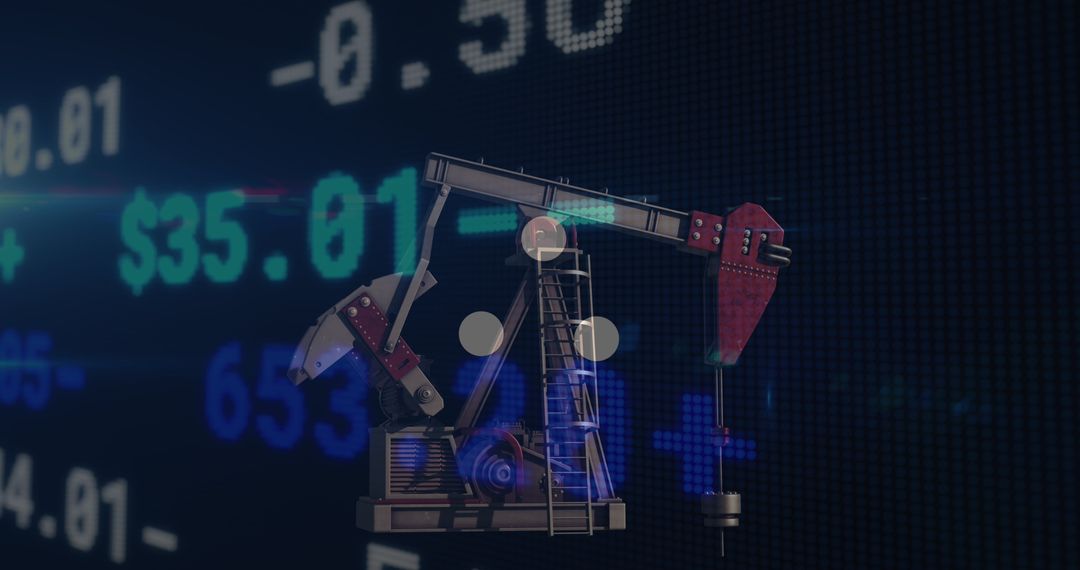
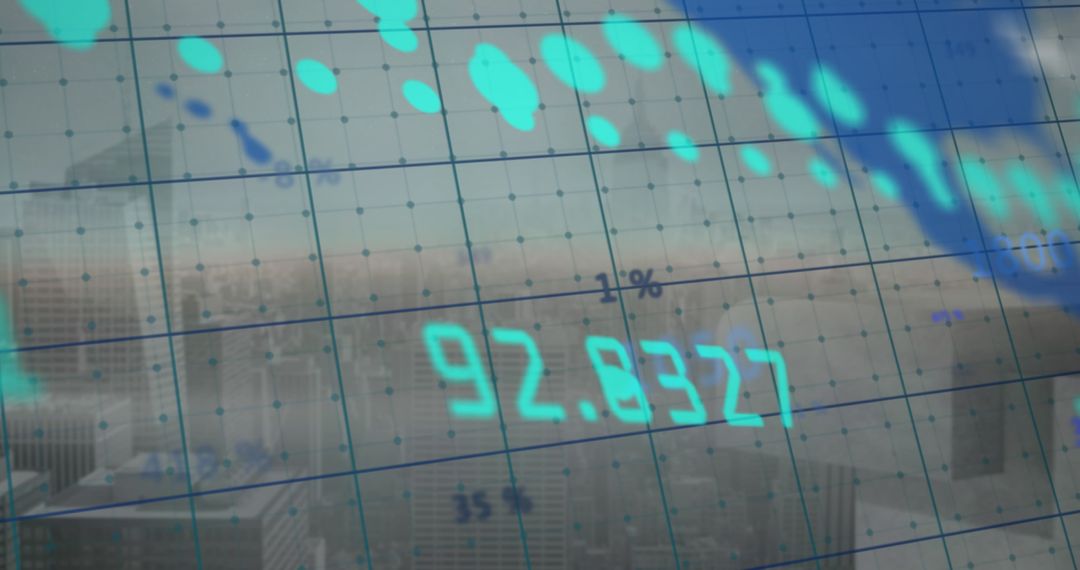
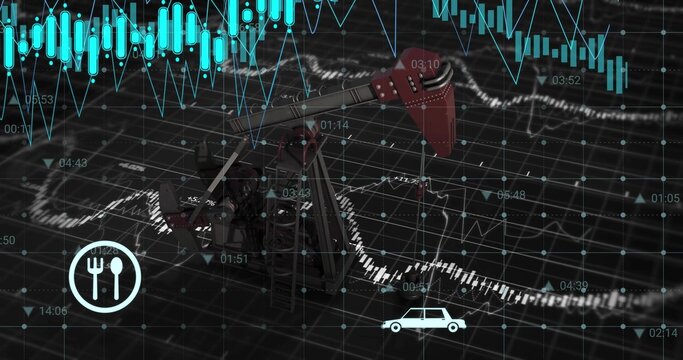
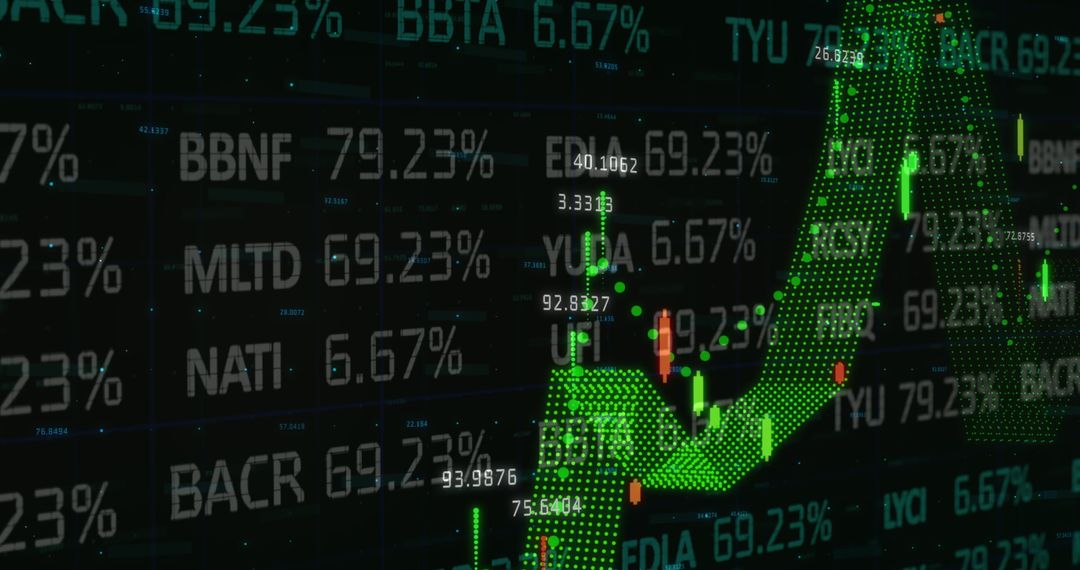
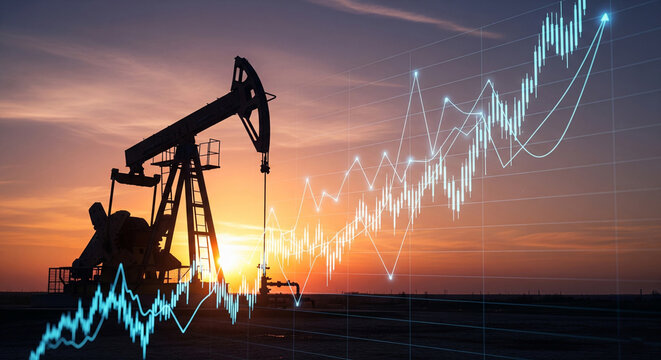
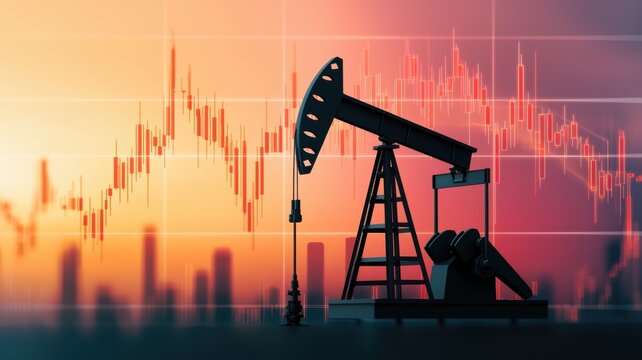
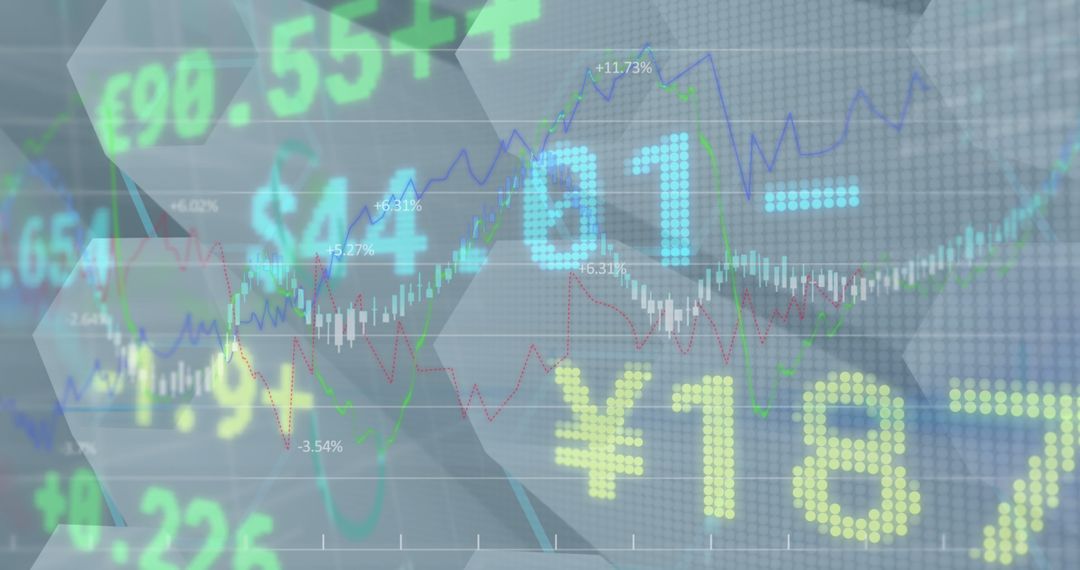
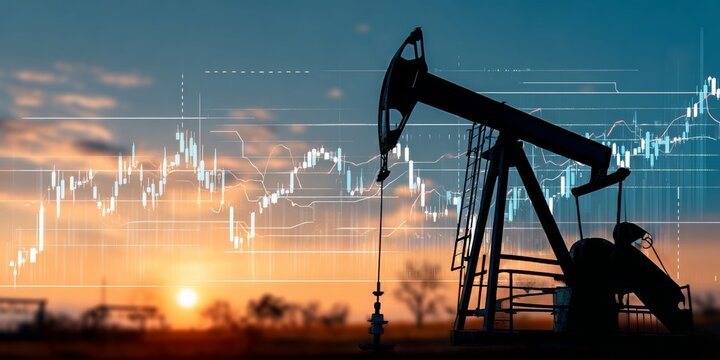
- Oil Pumpjack and Financial Data Overlapping Market Graphs
Oil Pumpjack and Financial Data Overlapping Market Graphs Image
This image illustrates the intersection of energy markets and financial trends using an oil pumpjack superimposed with stock market data and graphs. Ideal for articles on global economic factors, investment reports, and market analysis related to the oil industry. Useful for illustrating the complexities of financial and resource sector interdependencies.
Powered by 


2
downloads
downloads
Tags:
More
Credit Photo
If you would like to credit the Photo, here are some ways you can do so
Text Link
photo Link
<span class="text-link">
<span>
<a target="_blank" href=https://pikwizard.com/photo/oil-pumpjack-and-financial-data-overlapping-market-graphs/9d74c8b340616cd51930cda41a97a02b/>PikWizard</a>
</span>
</span>
<span class="image-link">
<span
style="margin: 0 0 20px 0; display: inline-block; vertical-align: middle; width: 100%;"
>
<a
target="_blank"
href="https://pikwizard.com/photo/oil-pumpjack-and-financial-data-overlapping-market-graphs/9d74c8b340616cd51930cda41a97a02b/"
style="text-decoration: none; font-size: 10px; margin: 0;"
>
<img src="https://pikwizard.com/pw/medium/9d74c8b340616cd51930cda41a97a02b.jpg" style="margin: 0; width: 100%;" alt="" />
<p style="font-size: 12px; margin: 0;">PikWizard</p>
</a>
</span>
</span>
Free (free of charge)
Free for personal and commercial use.
Author: People Creations
Similar Free Stock Images

Premium

Premium


Premium


Premium


Premium


Premium


Premium


Premium


Premium


Premium


Premium


Premium


Premium


Premium


Premium


Premium


Premium


Premium


Premium


Premium


Premium


Premium


Premium


Premium