1. Home > 
  2. Stock Photos > 
  3. Oil Rigs with Financial Charts and US Dollar Symbolism

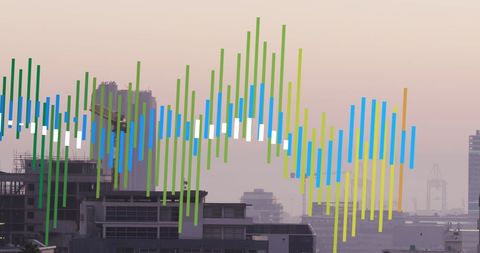
Oil Rigs with Financial Charts and US Dollar Symbolism Image

Oil Rigs with Financial Charts and US Dollar Symbolism

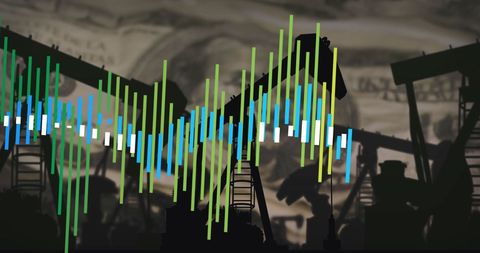
Silhouetted oil rigs blend with overlaid financial charts, implying energy market analytics. This engaging visual connects the realms of physical energy extraction with abstract economic data. Perfect for industries at the intersection of energy and finance, such as newsletters, presentations about the oil market, investment consulting, or articles on global energy economy.

Powered by Adobe logo
Silhouette of oil pumpjack on a shore against sunrise and digital stock market chart. Investment graph for energy industry. - Powered by AdobeOil drilling rigs at dusk with glowing financial graphs - Powered by AdobeOil and Finance Sunset - Dramatic sky with a setting sun illuminating oil rigs and a stock market chart - Powered by Adobeoil barrels wrapped with barbed wire standing in puddles with reflection, red arrow in cloudy sky, concept of falling oil prices.
 - Powered by AdobePetroleum pump equipment pack against stock market graph background, oil price concept visualization, energy trend analysis, commodity market indicators, financial performance metr - Powered by Adobe

Credit Photo

If you would like to credit the Photo, here are some ways you can do so

Free (free of charge)

Free for personal and commercial use.

Author: People Creations

Similar Free Stock Images

Loading...
Financial Data Visualization Analysis on Black Background
Premium
Oil pumpjack and refinery against a vibrant sunset with stock market data overlay
Digital Data Processing Over Modern Glass Building
Premium
Powerful model oil pump jack under dramatic spotlight. Symbol of petroleum industry, representing energy, fuel, business and economy
Premium
Oil pumpjack on circuit board with blurred financial data background
Futuristic Digital Data Analytics Visual Interface
European Map with Bar Chart Symbolizing Energy Economics
Financial Data Analysis with Charts and Graphs
Dynamic Financial Data Analysis with Interactive Charts and Graphs
Premium
Investment Insights On The Growing Oil Industry: Sunset Silhouette Of Pumpjacks Against Market Trends And Economic Graphs Reflecting Future Growth
Financial Data Integration with Oil Industry Conceptual Background
Oil Extraction and Economic Graphs Over Sunset Background
Financial Data Overlaid on Business Office Environment
Abstract Financial Data Visualization with Analytics
Premium
Oil Pump and Falling Stock Market Graph at Sunset
Financial Data Analysis Visualization in Modern Office Environment
Financial Data Overlay on Busy Construction Site
Dynamic Bars Overlapping Graph in Financial Analysis
Abstract Digital Data Analysis with Bar Chart on Dark Background
Premium
Oil drilling rigs at dusk with glowing financial graphs
Global Data Visualizations Over City Skylines
Caucasian Woman Reviewing Graphs on Mobile Device, Business Technology Concept
Financial Data Analysis with Chinese Flag Over Harbor
Premium
Oil rig silhouette at sunset over city skyline overlaid with stock market data
Digital Data Chart Visualization in Modern Office Environment
Financial Data Visualization Overlaying Workspace
Premium
Oil rig at sunset with stock market graph overlay
Binary Code with Colorful Bar Graph for Data Analysis
Digital Financial Data Visualizations and Technological Concepts
Abstract Digital Data Analytics with 3D Red Chart
Neon Audio Equalizer Overlay on Nighttime Urban Skyline
Premium
Oil rigs and stock market charts overlayed against a dramatic sunset sky. Symbolizes energy sector finance, commodity trading, investment growth, and economic volatility.
Digital Financial Data and Market Trends Analysis on Black Background
Digital Financial Data Over Urban Night Skyline
Dynamic Digital Data Integration with Urban Landscape
Abstract Digital Data Flow on Modern Building Facade
Colorful Bar Graph Rising Against Gradient Sky
Abstract Data Visualization with Growing Charts
Premium
Offshore oil rig at sunset overlaid with dynamic stock market graph, symbolizing energy market trends and investment
Premium
Rows of yellow orange and black oil drums stand on wet concrete ground. Reflections shimmer in puddles under a cloudy sky. Industrial storage perspective creates symmetrical vanishing point.
Premium
An offshore oil rig reflected on fluctuating charts and numbers; industry concept
Graphs Overlaying Cityscape with Technology and Data Visualization Theme
IT Engineers Analyzing Tech Data in Server Room
Silhouetted Oil Pump Jacks with Financial Graph Backdrop
Oil Rigs and Financial Data Overlaying Israel Flag
Premium
Oil drilling rig line art icon on a white background.
Financial Trends Amid Urban Construction Digital Interface
Colorful Financial Data Bars Over Cityscape at Dusk
Digital Financial Data Overlay on Urban Scaffolding Structure
Crane and Stock Market Graph for Business Growth Concept
Dynamic Trading Graph with Binary Coding Overlay
Oil Pump Silhouettes with Financial Data Visualization
Data Visualization Overlay in Dark Computer Server
Futuristic Data Analysis with Cityscape Background
Colorful Abstract Lines Overlapping Vibrant City Lights at Night
Colorful Graphical Data Analysis in Abstract Background
Multi-Colored Charts Superimposed Over Urban Skyline
Digital Financial Data Overlay on Modern Office Environment
Caucasian IT Professional Analyzing Data in Server Room
Premium
Oil pumps with stock market graph.
Urban Finance Data Visualization with Candlestick Chart Overlay
Premium
A digitally enhanced image of an oil pump jack with a financial chart.
Pumpjack with stock market charts overlay conveying oil energy sector financial analytics
Digital Data and Global Shipping Concept
Digital Data Visualization Over City Skyline at Night
Premium
energy stock gas trading. Oil rig silhouette against a colorful sunset and stock market graph backdrop.
Abstract Data Processing Visualization on Blue Gradient
Digital Data Analysis with Rising Arrows on Black Background
Abstract Financial Stock Market Data Interface
Colorful Data Streams in Digital Interface
Silhouette of Oil Pumpjacks Against US Dollar Background
Colorful Financial Data Visualization with Statistical Graphs
Oil Industry Finance with Pump Jacks and Data Overlay
Interpreting Digital Data in High-Tech Server Environment
Silhouetted Pump Jacks Against Russian Economic Data
Oil Pump Jacks with Overlay of Stock Market Data
Construction Site with Financial Data Overlay and Built-in Technology Concept
Dynamic Financial Data Analysis With Abstract Global Background
Financial Data Overlay on Construction Site with Crane
Premium
Oil rig at sunset with overlayed stock market graph
Construction and Financial Data Mashup with Urban Background
Financial Data Processing in Urban Skyline for Global Business
Financial Graphs Overlay with Oil Refinery Pump
Digital Financial Data Visualization with Bar Graphs and Line Charts
Premium
Oil and Finance Sunset - Dramatic sky with a setting sun illuminating oil rigs and a stock market chart
Dynamic Data Display with Bars and Lines on Grid Background
Financial Data Analysis on Digital Graph Interface with Abstract Office Background
Premium
Double exposure artistic composition of drilling rigs and ascending financial chart, warm sunset atmosphere, global energy market dynamics, oil industry growth, financial trends ov
Digital Data Visualization on Futuristic Network Servers
Financial Data Visualization Over Server Room
Digital Data Analytics Over Cityscape Transforming Global Business
Premium
Oil pumpjack with stack of coins and stock chart against blurred American flag
Agricultural Data Visualization at Dawn with Irrigation System
Colorful Sound Waves Over Night Cityscape with Neon Lights
Financial Growth Concept with Cityscape Overlay Design
Abstract Digital Data Processing Over City Skyline
Futuristic Data Overlay on Modern Glass Building with Green Hues
Dynamic Data Visualization on Digital Interface
Colorful Digital Waveform Chart Analytics
Dynamic Digital Financial Analysis with 3D Graphics
Dynamic Digital Stock Market Data Visualization
Pumpjacks Operating Against Banknote Background
Abstract Financial Data Analysis Conceptual Design
Oil Pump Jacks Silhouetted Against Russian Flag and Currency
Businessman Analyzing Data with Overlaid Graphs in Office
Premium
Oil pumpjacks operate at sunset over a vast oil field, highlighting industrial energy extraction amid a colorful sky.
Premium
Gold bars, crude oil rigs sit in ground at sunset. Shiny precious metal bars, energetic industry equipment represent wealth, resource extraction. Both assets signify financial investment, global
Financial Data Processing Against Vibrant Cityscape Background
Financial Data with Cityscape Background
Dynamic Financial Data Analysis on Digital Platform
Financial Data Overlays in Modern Office Workspace
Premium
Oil rig on a digital stock market graph showcasing fluctuating prices and trends
Premium
Silhouette of oil pumpjack on a shore against sunrise and digital stock market chart. Investment graph for energy industry.
Abstract Multicolored Graphs Overlay on Office Desk Setting
Dynamic Graphs over Empty Office Symbolize Business Progress
Bar Graph Overlay on City Skyline Illustrating Data Analysis Concept
Premium
Offshore oil rig platform in sea at dusk. Overlay rising stock market graph. Concept of fuel energy business, global oil prices, supply and demand, economic growth, and international trade impact.
Digital Data Visualization on Office Desk Background
Financial Data Representation in Modern Office Context
Abstract Digital Connections over Data Graphics Network
Financial Data Processing in Digital Interface Concept
Digital Data Display Over Electrical Pylons at Sunset
Digital Faces Among Stock Market Data Lines
Wind Turbines in Sunset with Equalizer Overlay and Copy Space
Futuristic Data Visualization with Bars and Pie Charts