- Home >
- Stock Photos >
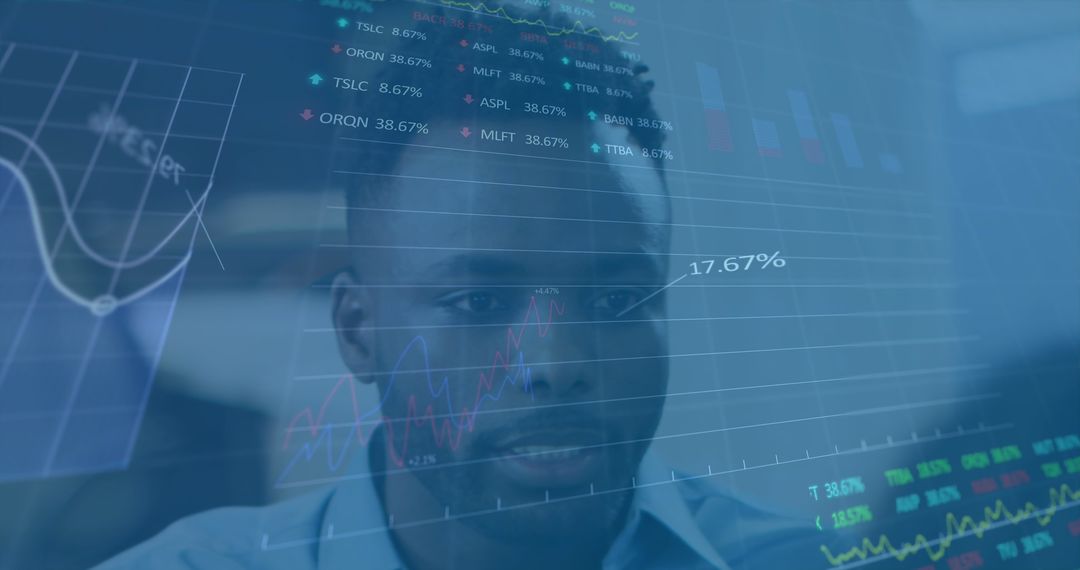
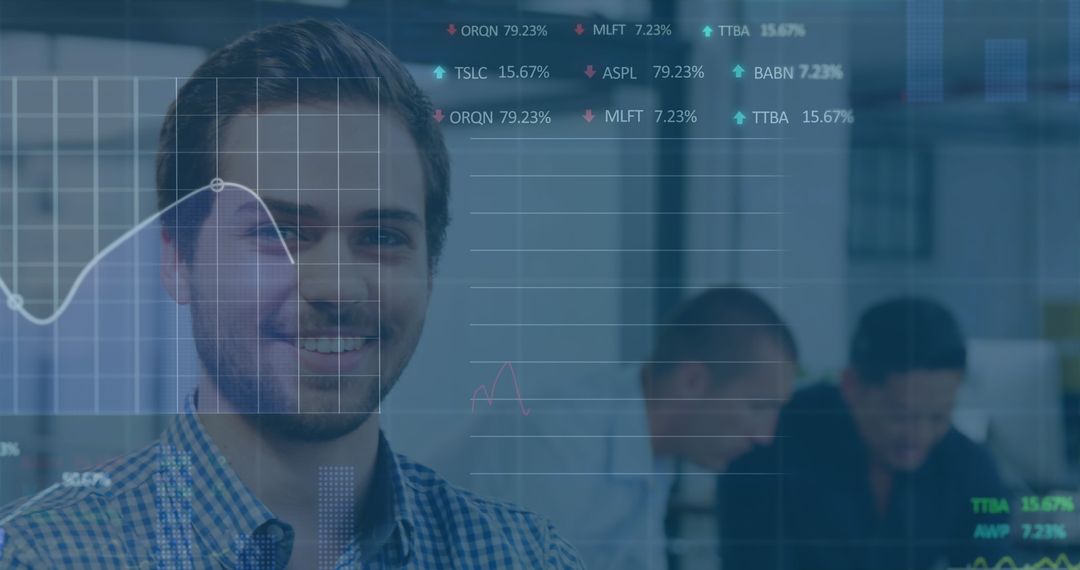
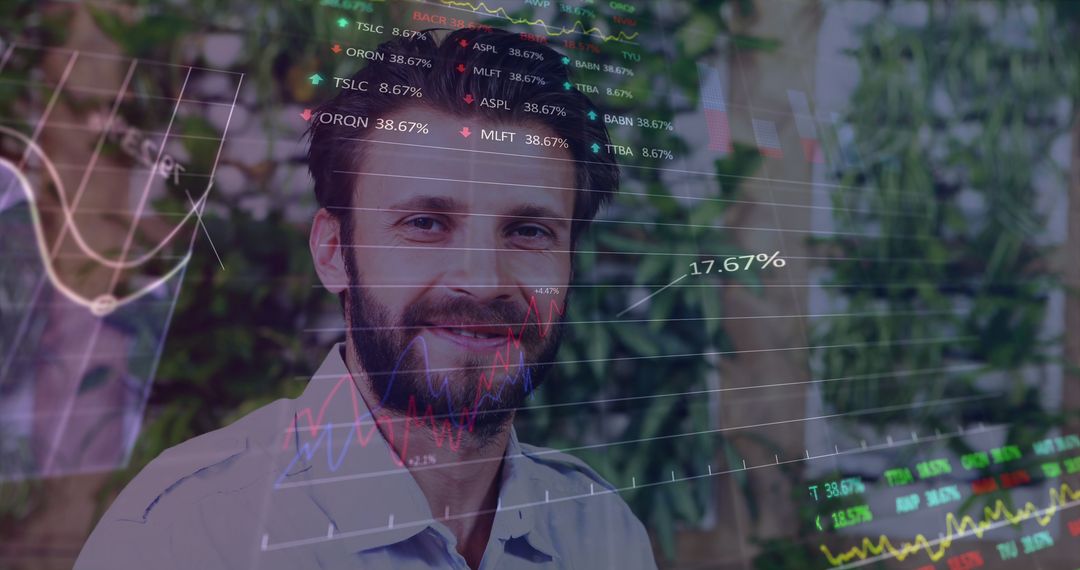
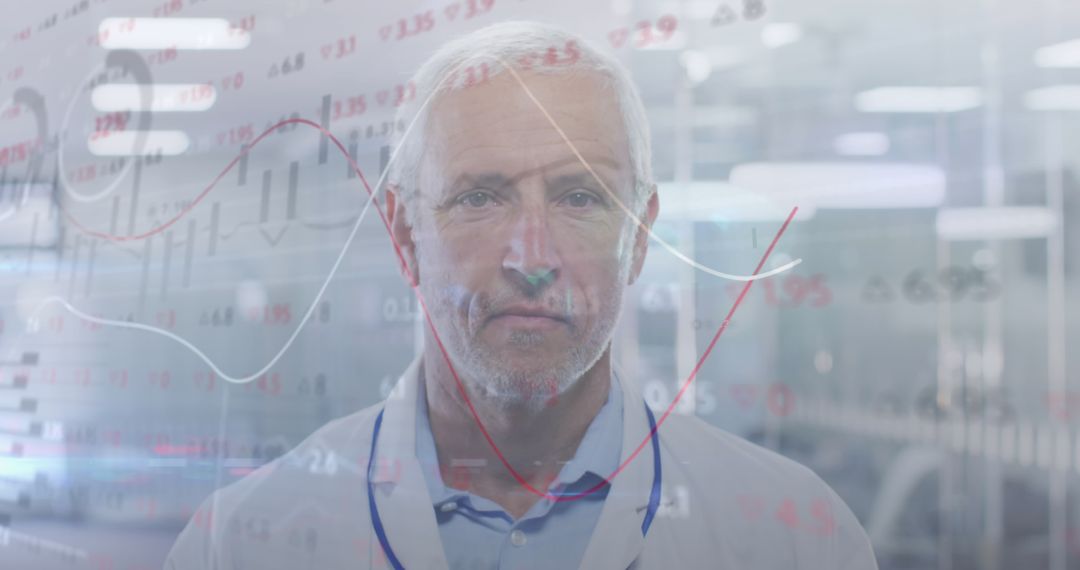
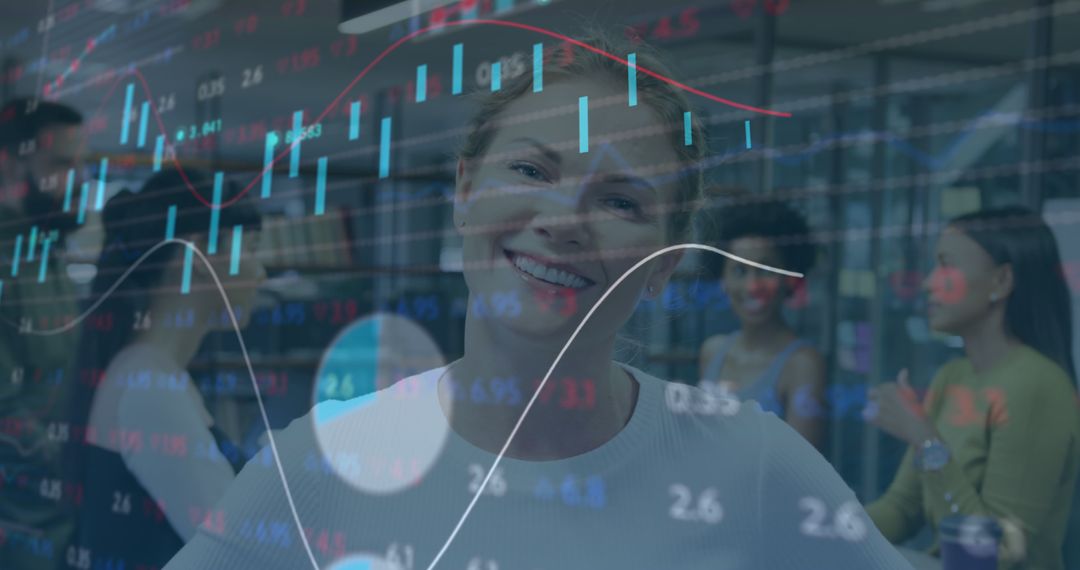
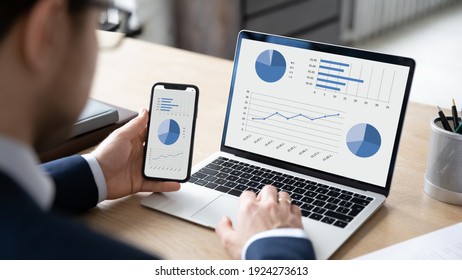
- Optimistic Businessman Analyzing Financial and Data Trends
Optimistic Businessman Analyzing Financial and Data Trends Image

Smiling businessman overseeing a digital interface with graphs indicates enthusiasm and foresight in business and financial analytics. Ideal for content relating to financial growth, positive business relationships, partnerships, or promotional imagery for business services.
Powered by  - Get 15% off with code: PIKWIZARD15


2
downloads
downloads
Tags:
More
Credit Photo
If you would like to credit the Photo, here are some ways you can do so
Text Link
photo Link
<span class="text-link">
<span>
<a target="_blank" href=https://pikwizard.com/photo/optimistic-businessman-analyzing-financial-and-data-trends/a540c83e2a719ef5875a5727abfac6de/>PikWizard</a>
</span>
</span>
<span class="image-link">
<span
style="margin: 0 0 20px 0; display: inline-block; vertical-align: middle; width: 100%;"
>
<a
target="_blank"
href="https://pikwizard.com/photo/optimistic-businessman-analyzing-financial-and-data-trends/a540c83e2a719ef5875a5727abfac6de/"
style="text-decoration: none; font-size: 10px; margin: 0;"
>
<img src="https://pikwizard.com/pw/medium/a540c83e2a719ef5875a5727abfac6de.jpg" style="margin: 0; width: 100%;" alt="" />
<p style="font-size: 12px; margin: 0;">PikWizard</p>
</a>
</span>
</span>
Free (free of charge)
Free for personal and commercial use.
Author: People Creations
Similar Free Stock Images
Premium


Premium


Premium


Premium


Premium


Premium


Premium


Premium


Premium


Premium


Premium


Premium


Premium


Premium


Premium


Premium


Premium


Premium


Premium


Premium


Premium


Premium


Premium


Premium