
- Home >
- Stock Photos >
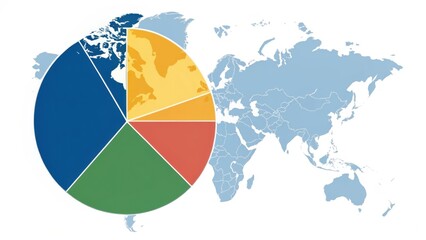
- Orange-Toned Data Visualization Featuring World Map and Pie Charts
Orange-Toned Data Visualization Featuring World Map and Pie Charts Image

Abstract design with dynamic pie charts and global map showcases business insights and trends. Orange hues emphasize the focus on analytical data representation. Perfect for presentations, finance reports, or educational materials about market analysis or global studies.
Powered by 


downloads
Tags:
More
Credit Photo
If you would like to credit the Photo, here are some ways you can do so
Text Link
photo Link
<span class="text-link">
<span>
<a target="_blank" href=https://pikwizard.com/photo/orange-toned-data-visualization-featuring-world-map-and-pie-charts/3940bfb822e483276aa56879fffe7e36/>PikWizard</a>
</span>
</span>
<span class="image-link">
<span
style="margin: 0 0 20px 0; display: inline-block; vertical-align: middle; width: 100%;"
>
<a
target="_blank"
href="https://pikwizard.com/photo/orange-toned-data-visualization-featuring-world-map-and-pie-charts/3940bfb822e483276aa56879fffe7e36/"
style="text-decoration: none; font-size: 10px; margin: 0;"
>
<img src="https://pikwizard.com/pw/medium/3940bfb822e483276aa56879fffe7e36.jpg" style="margin: 0; width: 100%;" alt="" />
<p style="font-size: 12px; margin: 0;">PikWizard</p>
</a>
</span>
</span>
Free (free of charge)
Free for personal and commercial use.
Author: Awesome Content
Similar Free Stock Images

Premium


Premium


Premium


Premium


Premium


Premium


Premium


Premium
Premium


Premium

Premium

Premium


Premium


Premium

Premium


Premium

Premium


Premium
Premium

Premium


Premium


Premium
Premium


Premium

Premium


Explore More Free Stock Images