- Home >
- Stock Photos >
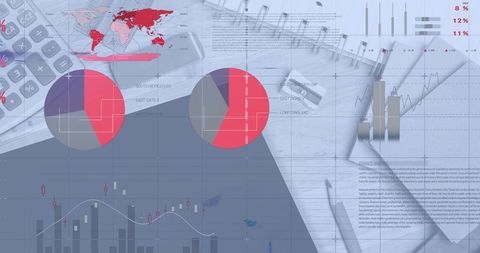
- Overlapping Financial Documents with Stationery and Pie Chart
Overlapping Financial Documents with Stationery and Pie Chart Image

Visual of financial documents overlaying desk with stationery items, incorporating digital and print elements related to global finance and economic data processing. Ideal for illustrating concepts such as business strategy, financial analysis, and computational tools in finance presentations or reports.
Powered by  - Get 15% off with code: PIKWIZARD15


6
downloads
downloads
Tags:
More
Credit Photo
If you would like to credit the Photo, here are some ways you can do so
Text Link
photo Link
<span class="text-link">
<span>
<a target="_blank" href=https://pikwizard.com/photo/overlapping-financial-documents-with-stationery-and-pie-chart/0ce20873832e3d3f78d43e026902fd58/>PikWizard</a>
</span>
</span>
<span class="image-link">
<span
style="margin: 0 0 20px 0; display: inline-block; vertical-align: middle; width: 100%;"
>
<a
target="_blank"
href="https://pikwizard.com/photo/overlapping-financial-documents-with-stationery-and-pie-chart/0ce20873832e3d3f78d43e026902fd58/"
style="text-decoration: none; font-size: 10px; margin: 0;"
>
<img src="https://pikwizard.com/pw/medium/0ce20873832e3d3f78d43e026902fd58.jpg" style="margin: 0; width: 100%;" alt="" />
<p style="font-size: 12px; margin: 0;">PikWizard</p>
</a>
</span>
</span>
Free (free of charge)
Free for personal and commercial use.
Author: Creative Art
Similar Free Stock Images
Loading...

Premium


Premium

Premium


Premium


Premium


Premium


Premium

Premium

Premium

Premium


Premium


Premium

Premium

Premium


Premium

Premium

Premium


Premium


Premium


Premium

Premium


Premium


Premium


Premium


Premium