- Home >
- Stock Photos >
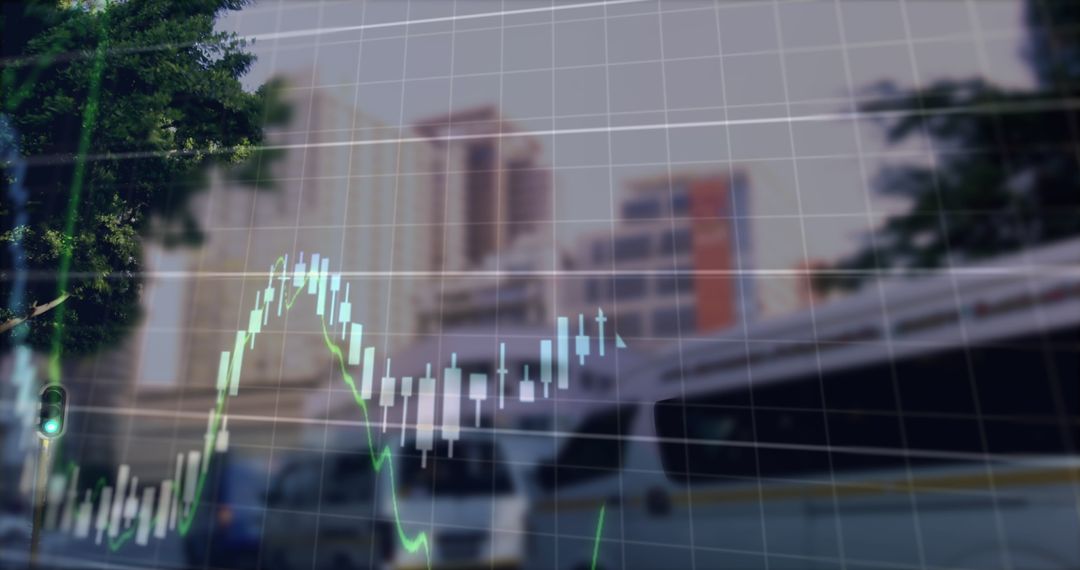
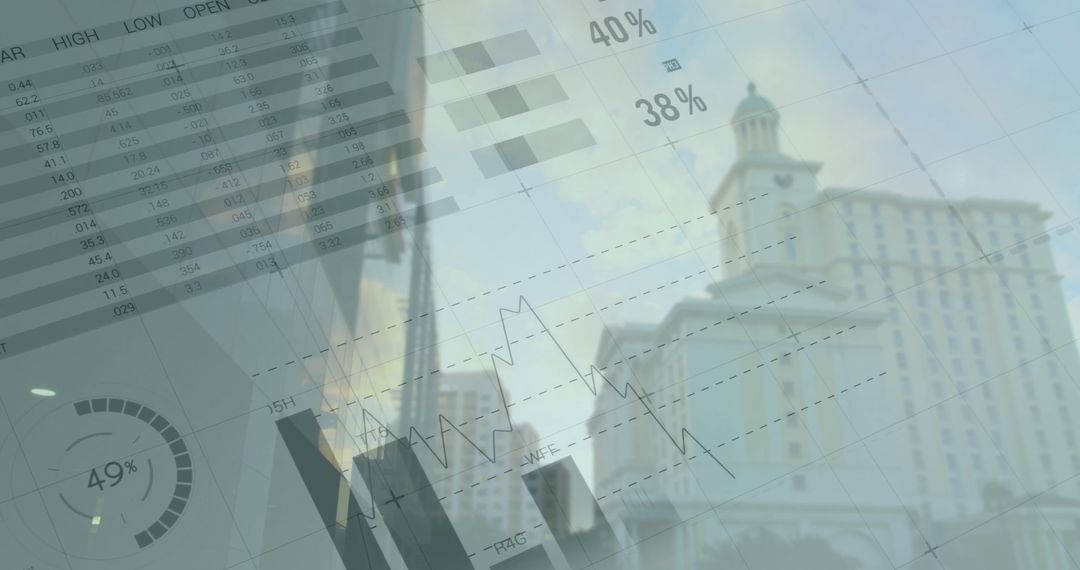
- Overlay of Data Graph on City Time-lapse Symbolizing Economic Trends
Overlay of Data Graph on City Time-lapse Symbolizing Economic Trends Image

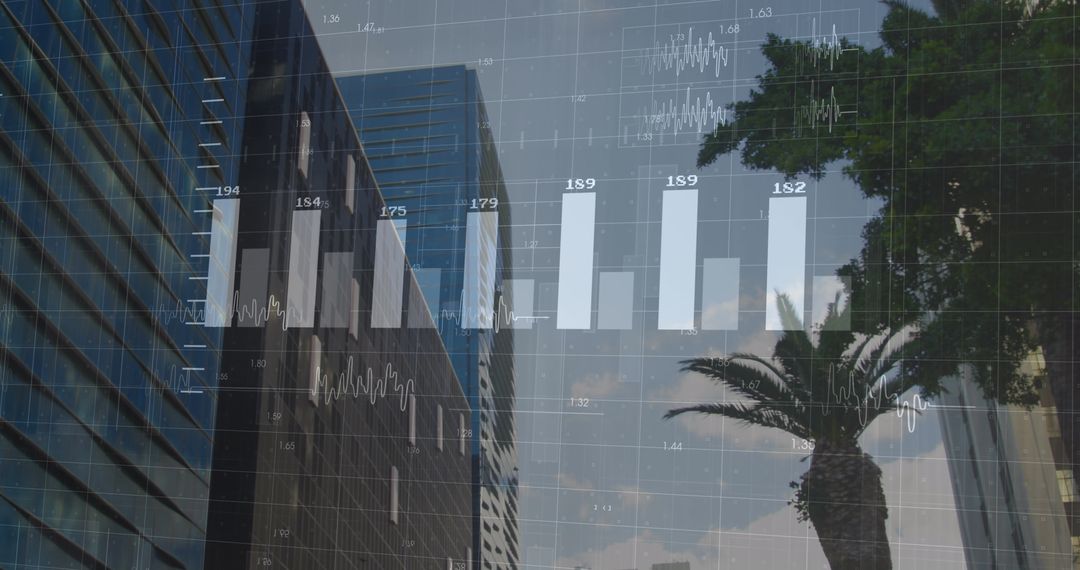
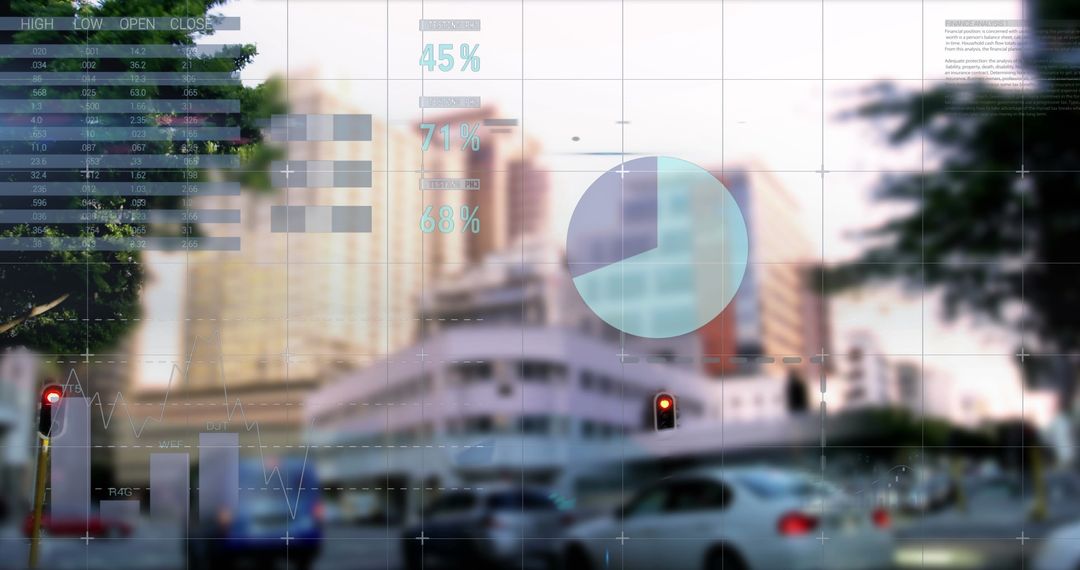
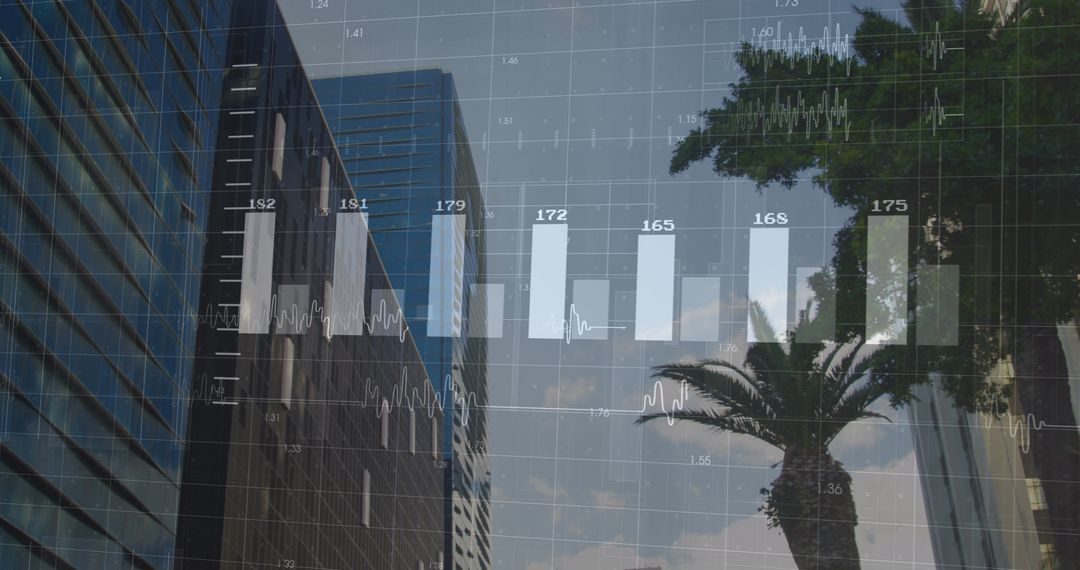
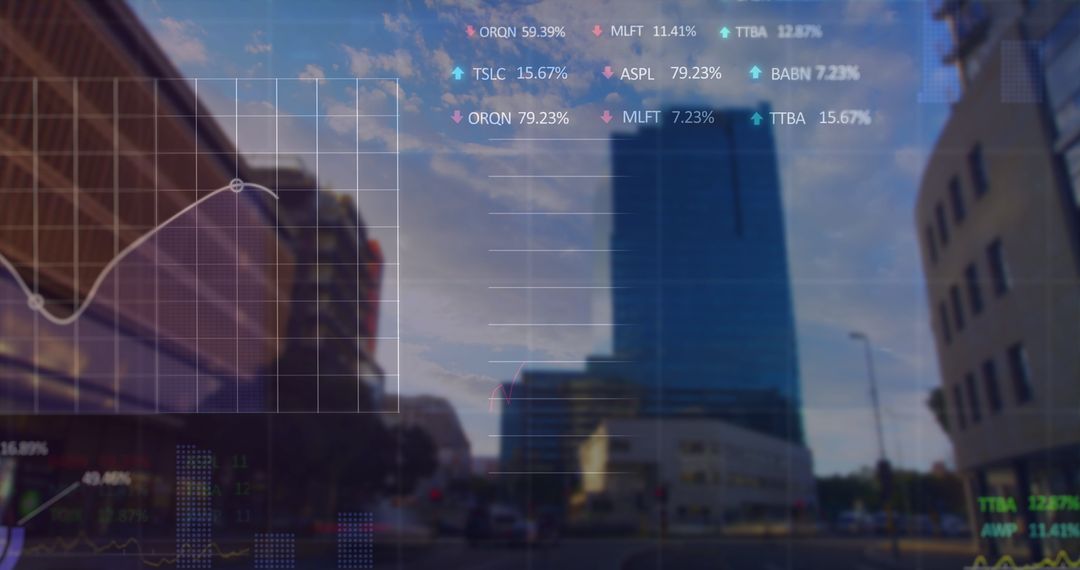
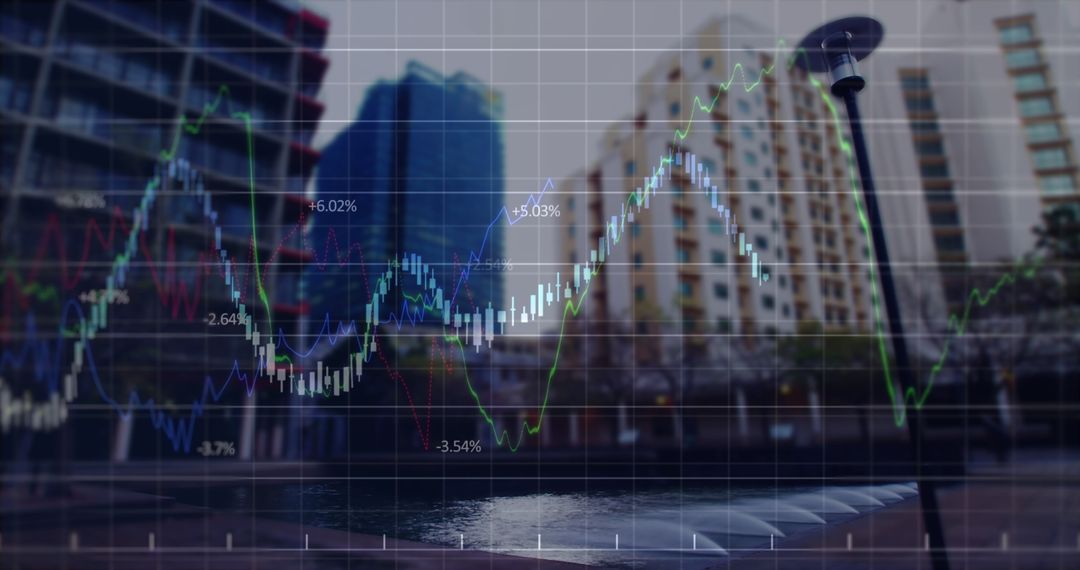
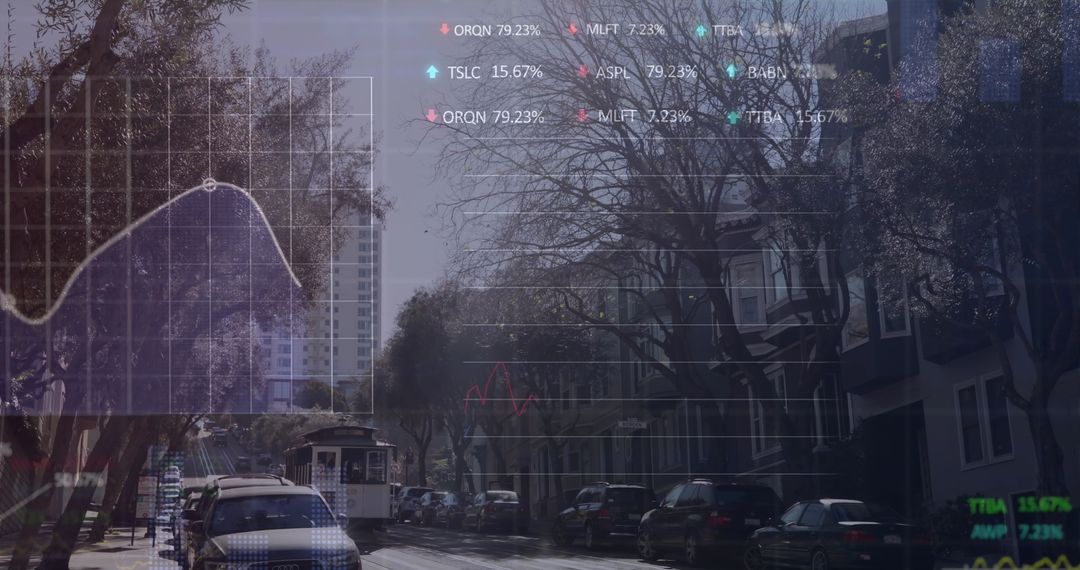
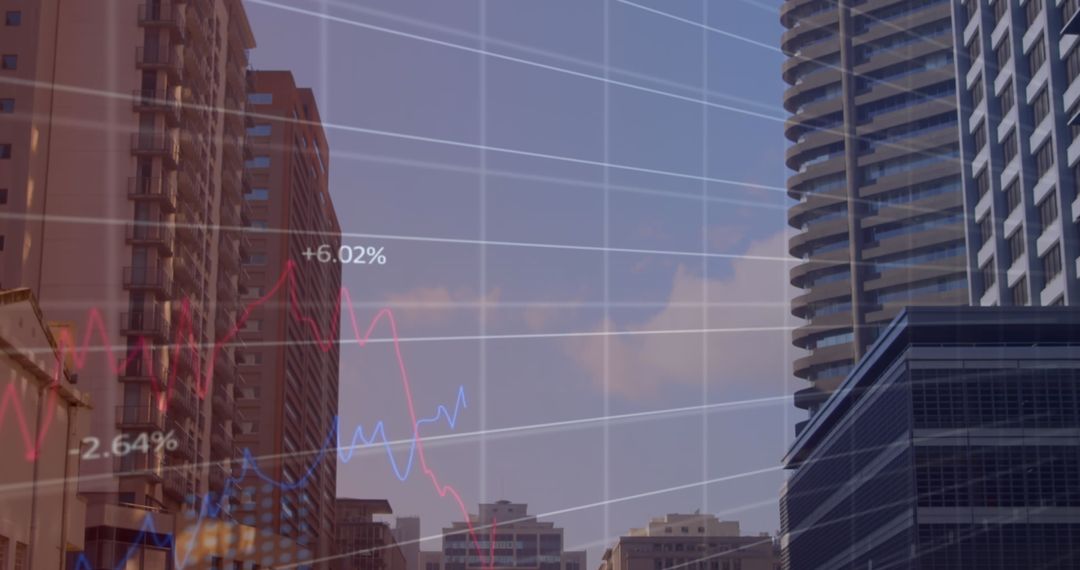
A blend of digital statistical graphs overlays a bustling city street, conveying concepts of data analysis and economic monitoring. Ideal for use in financial reports, presentations, or articles on technology's impact on global business trends, illustrating the intersection of urban life and digital economy.
Powered by  - Get 15% off with code: PIKWIZARD15


2
downloads
downloads
Tags:
More
Credit Photo
If you would like to credit the Photo, here are some ways you can do so
Text Link
photo Link
<span class="text-link">
<span>
<a target="_blank" href=https://pikwizard.com/photo/overlay-of-data-graph-on-city-time-lapse-symbolizing-economic-trends/ed03d1f710f60447ed6153c24a831dbf/>PikWizard</a>
</span>
</span>
<span class="image-link">
<span
style="margin: 0 0 20px 0; display: inline-block; vertical-align: middle; width: 100%;"
>
<a
target="_blank"
href="https://pikwizard.com/photo/overlay-of-data-graph-on-city-time-lapse-symbolizing-economic-trends/ed03d1f710f60447ed6153c24a831dbf/"
style="text-decoration: none; font-size: 10px; margin: 0;"
>
<img src="https://pikwizard.com/pw/medium/ed03d1f710f60447ed6153c24a831dbf.jpg" style="margin: 0; width: 100%;" alt="" />
<p style="font-size: 12px; margin: 0;">PikWizard</p>
</a>
</span>
</span>
Free (free of charge)
Free for personal and commercial use.
Author: Authentic Images
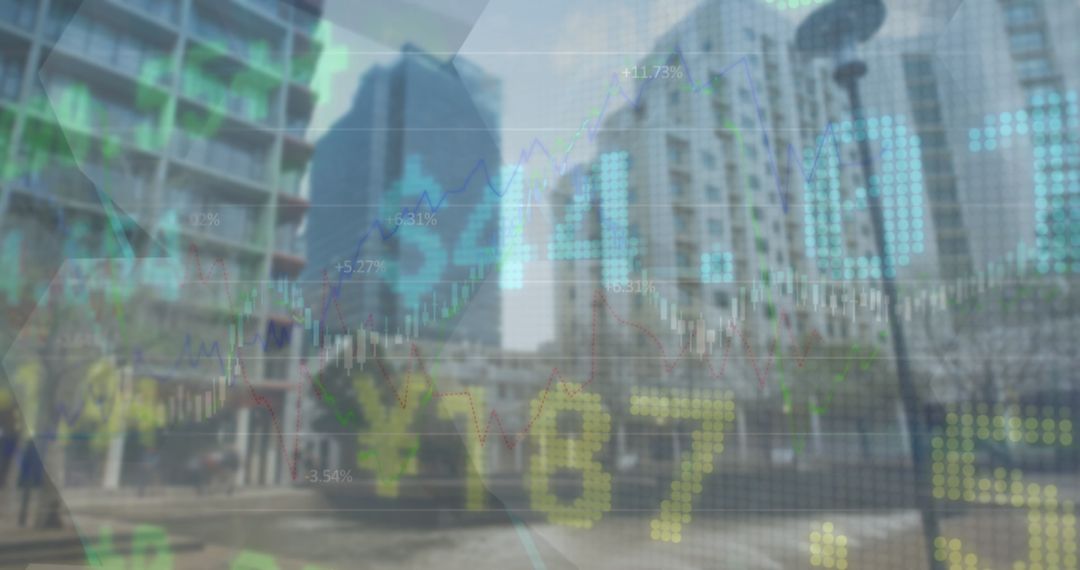
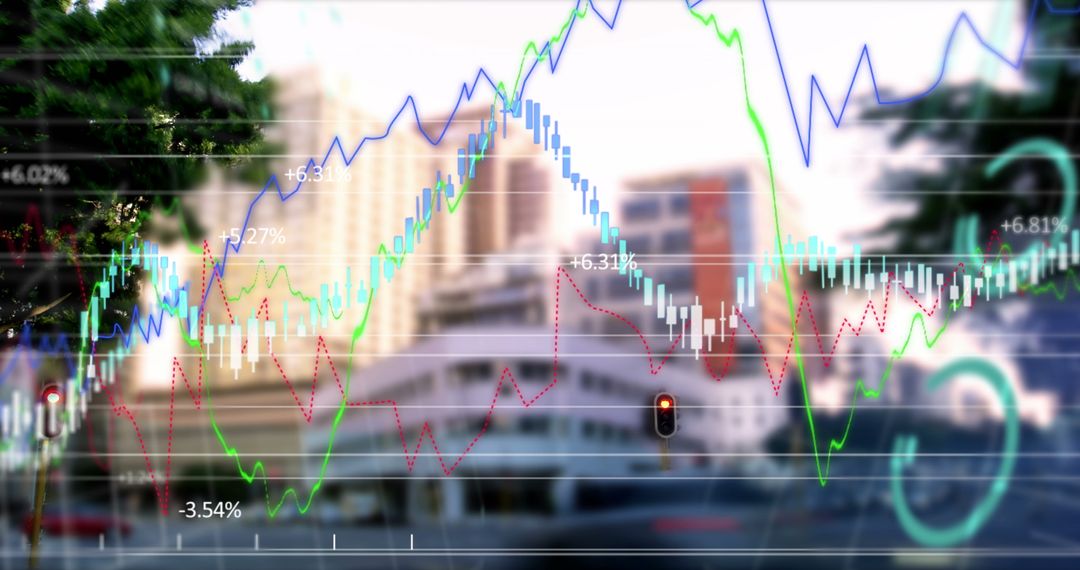
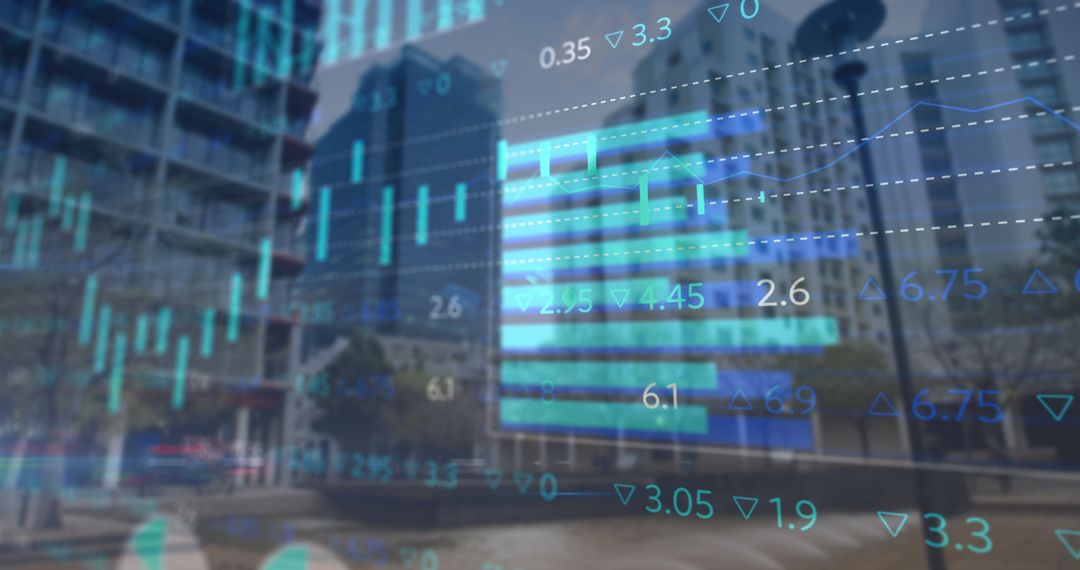
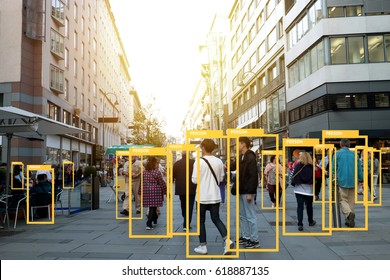
Similar Free Stock Images

Premium


Premium


Premium


Premium


Premium


Premium


Premium


Premium


Premium


Premium


Premium


Premium


Premium


Premium


Premium


Premium


Premium


Premium


Premium


Premium


Premium


Premium


Premium


Premium