- Home >
- Stock Photos >
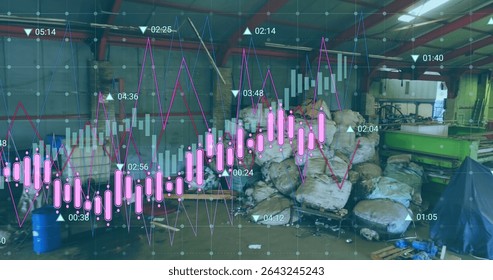
- Overlay of Financial Data with Warehouse Workers in Background
Overlay of Financial Data with Warehouse Workers in Background Image

Visually presenting the relationship between financial data and warehouse productivity through an overlay of digital graphs and figures amidst background silhouettes of warehouse workers. Ideal for use in business presentations, financial analysis reports, or articles related to economy and logistics industry. Emphasizes the connection between market trends and industry operations.
Powered by  - Get 15% off with code: PIKWIZARD15


downloads
Tags:
More
Credit Photo
If you would like to credit the Photo, here are some ways you can do so
Text Link
photo Link
<span class="text-link">
<span>
<a target="_blank" href=https://pikwizard.com/photo/overlay-of-financial-data-with-warehouse-workers-in-background/147167c0557fae46b3205f390a98d607/>PikWizard</a>
</span>
</span>
<span class="image-link">
<span
style="margin: 0 0 20px 0; display: inline-block; vertical-align: middle; width: 100%;"
>
<a
target="_blank"
href="https://pikwizard.com/photo/overlay-of-financial-data-with-warehouse-workers-in-background/147167c0557fae46b3205f390a98d607/"
style="text-decoration: none; font-size: 10px; margin: 0;"
>
<img src="https://pikwizard.com/pw/medium/147167c0557fae46b3205f390a98d607.jpg" style="margin: 0; width: 100%;" alt="" />
<p style="font-size: 12px; margin: 0;">PikWizard</p>
</a>
</span>
</span>
Free (free of charge)
Free for personal and commercial use.
Author: People Creations
Similar Free Stock Images
Loading...

Premium


Premium


Premium


Premium


Premium


Premium


Premium


Premium


Premium


Premium


Premium


Premium


Premium


Premium


Premium


Premium


Premium

Premium


Premium


Premium


Premium


Premium


Premium


Premium

Premium