- Home >
- Stock Photos >
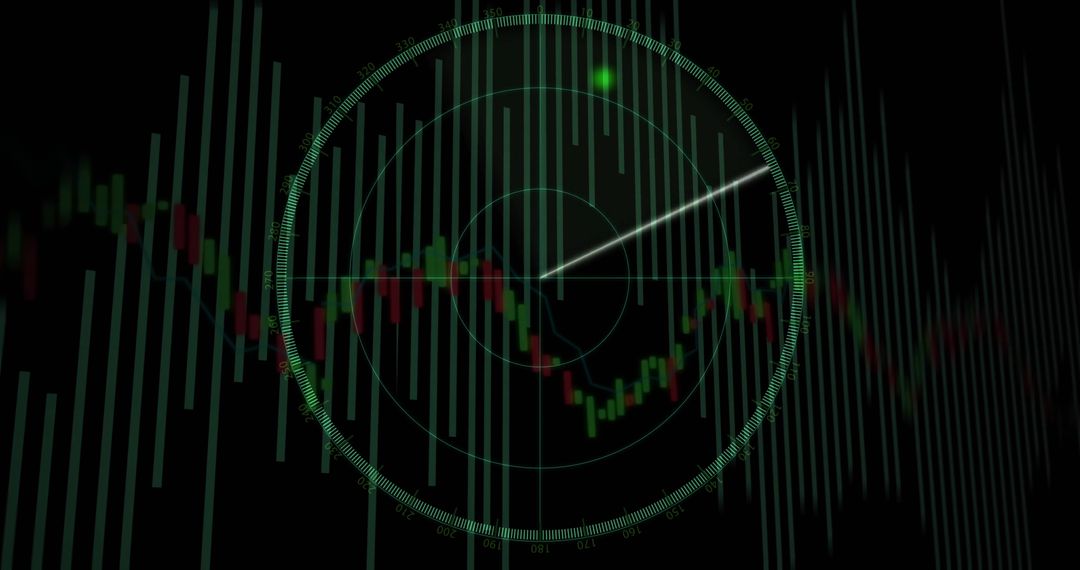
- Overlay of Financial Graph Over Clockwork Gears
Overlay of Financial Graph Over Clockwork Gears Image

Combination of financial data graphing overlaid on intricate clockwork gears suggesting precision and timing in business and analysis. Ideal for illustrating concepts of global finance, technological advancement, business automation, and the interrelationship of finance and mechanics.
Powered by  - Get 15% off with code: PIKWIZARD15


4
downloads
downloads
Tags:
More
Credit Photo
If you would like to credit the Photo, here are some ways you can do so
Text Link
photo Link
<span class="text-link">
<span>
<a target="_blank" href=https://pikwizard.com/photo/overlay-of-financial-graph-over-clockwork-gears/7d8d73f11b7e9217081ec91e7bdd818d/>PikWizard</a>
</span>
</span>
<span class="image-link">
<span
style="margin: 0 0 20px 0; display: inline-block; vertical-align: middle; width: 100%;"
>
<a
target="_blank"
href="https://pikwizard.com/photo/overlay-of-financial-graph-over-clockwork-gears/7d8d73f11b7e9217081ec91e7bdd818d/"
style="text-decoration: none; font-size: 10px; margin: 0;"
>
<img src="https://pikwizard.com/pw/medium/7d8d73f11b7e9217081ec91e7bdd818d.jpg" style="margin: 0; width: 100%;" alt="" />
<p style="font-size: 12px; margin: 0;">PikWizard</p>
</a>
</span>
</span>
Free (free of charge)
Free for personal and commercial use.
Author: Creative Art
Similar Free Stock Images

Premium


Premium


Premium


Premium


Premium


Premium


Premium


Premium


Premium


Premium


Premium


Premium


Premium


Premium


Premium


Premium


Premium


Premium


Premium


Premium


Premium


Premium


Premium


Premium