- Home >
- Stock Photos >
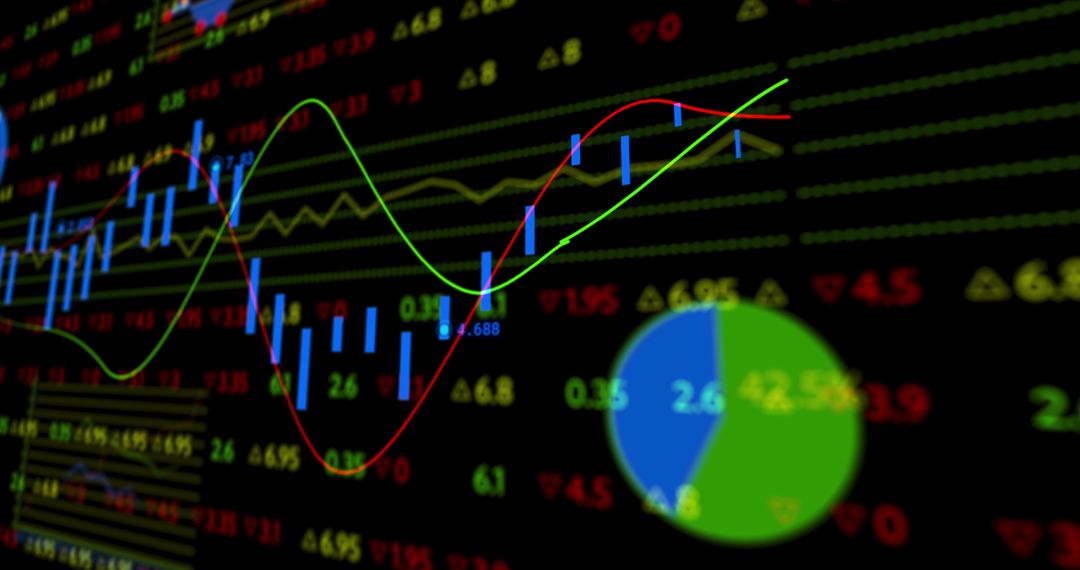
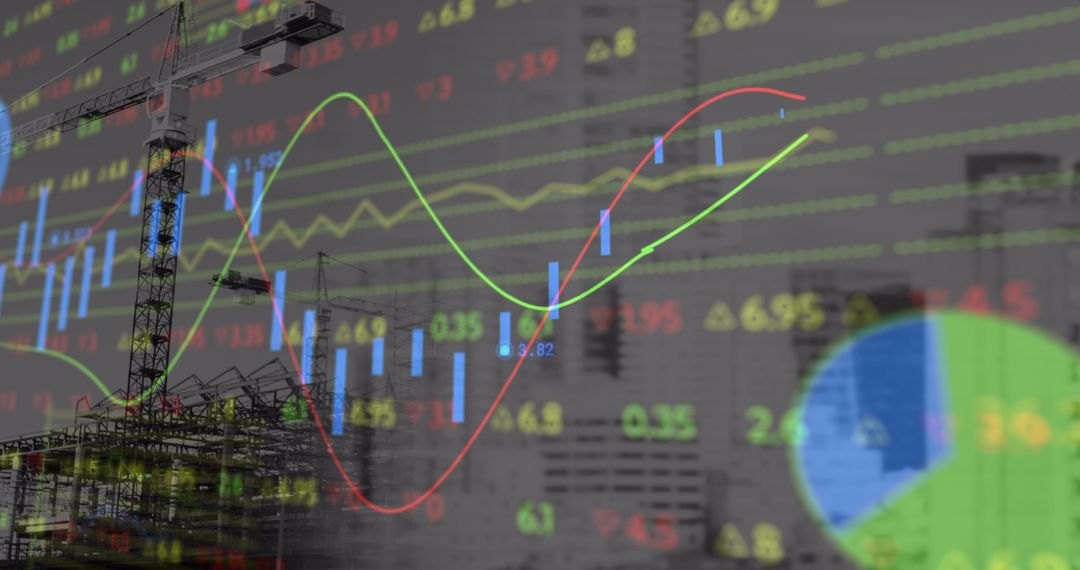
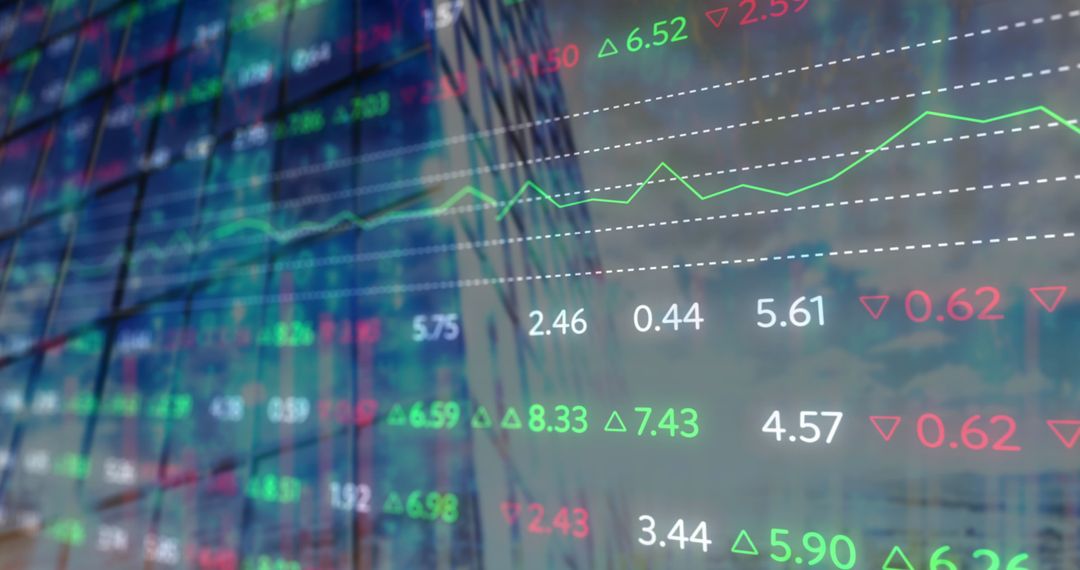
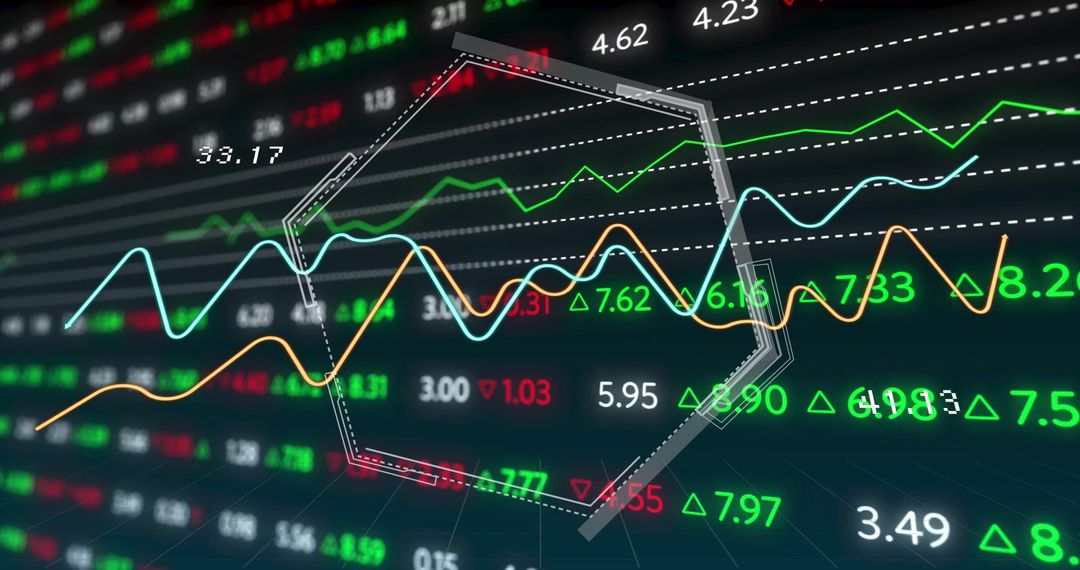
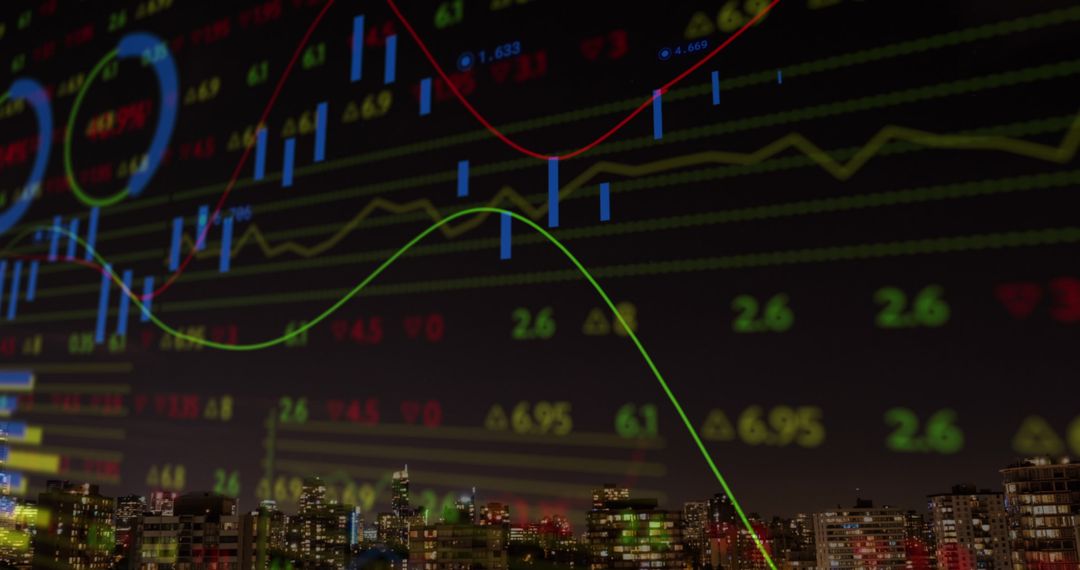
- Overlaying Candlestick Charts on Urban Office Skyline Featuring Neon Trading Indicators
Overlaying Candlestick Charts on Urban Office Skyline Featuring Neon Trading Indicators Image

Showing candlestick chart with blue wicks and green-red moving average lines overlaying modern office facades and urban skyline. Featuring volume bars, numeric tickers, and gridlines for dynamic market dashboard feel. Delivering neon color palette and high contrast for futuristic finance and technology themes. Use for website headers, fintech landing pages, trading platform UI mockups, blog headers about market trends, financial reports, investment presentations, and pitch decks for brokerage or asset management firms. Working well as background for data-driven layouts, editorial illustrations on volatility, and marketing materials for trading education. Providing ample negative space for headline placement and bold typography. Suggesting cropping for vertical formats or adding semi-transparent panels for improved text readability.
Powered by  - Get 15% off with code: PIKWIZARD15


0
downloads
downloads
Tags:
More
Credit Photo
If you would like to credit the Photo, here are some ways you can do so
Text Link
photo Link
<span class="text-link">
<span>
<a target="_blank" href=https://pikwizard.com/photo/overlaying-candlestick-charts-on-urban-office-skyline-featuring-neon-trading-indicators/7ed0a126b38533e48d836c8ff7b4f8fe/>PikWizard</a>
</span>
</span>
<span class="image-link">
<span
style="margin: 0 0 20px 0; display: inline-block; vertical-align: middle; width: 100%;"
>
<a
target="_blank"
href="https://pikwizard.com/photo/overlaying-candlestick-charts-on-urban-office-skyline-featuring-neon-trading-indicators/7ed0a126b38533e48d836c8ff7b4f8fe/"
style="text-decoration: none; font-size: 10px; margin: 0;"
>
<img src="https://pikwizard.com/pw/medium/7ed0a126b38533e48d836c8ff7b4f8fe.jpg" style="margin: 0; width: 100%;" alt="" />
<p style="font-size: 12px; margin: 0;">PikWizard</p>
</a>
</span>
</span>
Free (free of charge)
Free for personal and commercial use.
Author: Awesome Content
Similar Free Stock Images
Premium


Premium


Premium


Premium


Premium


Premium


Premium


Premium


Premium


Premium


Premium


Premium


Premium


Premium


Premium


Premium


Premium


Premium


Premium


Premium


Premium


Premium


Premium


Premium