
- Home >
- Free Stock Photos & Images >
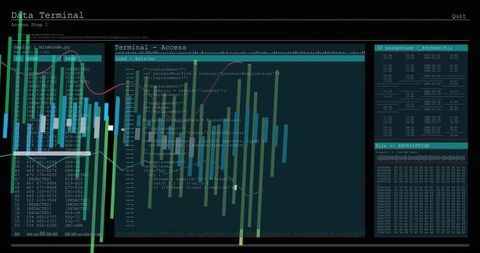
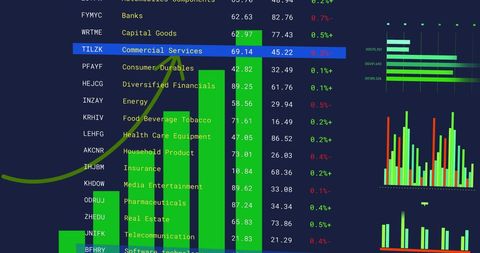
- Overlaying SQL Code with Financial Charts for Data Analytics and Trading Visualization
Overlaying SQL Code with Financial Charts for Data Analytics and Trading Visualization Free Stock Image

Displaying SQL query text layered with translucent bar and line charts, conveying data analytics and financial modeling concepts. Featuring gridlines, numeric scales, and colorful metric bars, suiting use in fintech, business intelligence, and developer content. Working well for blog headers, presentation slides, whitepapers, website hero banners, and marketing campaigns. Providing horizontal composition and muted blue-gray palette with bright accent bars for clear focal points. Allowing addition of text, logos, or data callouts in negative space for custom branding and editorial use.
Powered by  - Get 15% off with code: PIKWIZARD15


downloads
Tags:
More
Credit Photo
If you would like to credit the Photo, here are some ways you can do so
Text Link
photo Link
<span class="text-link">
<span>
<a target="_blank" href=https://pikwizard.com/photo/overlaying-sql-code-with-financial-charts-for-data-analytics-and-trading-visualization/bbcbf221d0a62932df0cde4d16748093/>PikWizard</a>
</span>
</span>
<span class="image-link">
<span
style="margin: 0 0 20px 0; display: inline-block; vertical-align: middle; width: 100%;"
>
<a
target="_blank"
href="https://pikwizard.com/photo/overlaying-sql-code-with-financial-charts-for-data-analytics-and-trading-visualization/bbcbf221d0a62932df0cde4d16748093/"
style="text-decoration: none; font-size: 10px; margin: 0;"
>
<img src="https://thumbs.wbm.im/pw/medium/bbcbf221d0a62932df0cde4d16748093.jpg" style="margin: 0; width: 100%;" alt="Overlaying SQL Code with Financial Charts for Data Analytics and Trading Visualization" />
<p style="font-size: 12px; margin: 0;">PikWizard</p>
</a>
</span>
</span>
Free (free of charge)
Free for personal and commercial use.
Author: Authentic Images
Similar Free Stock Images


Premium


Premium


Premium


Premium


Premium


Premium


Premium


Premium


Premium


Premium


Premium


Premium


Premium


Premium


AI


Premium


Premium


Premium


Premium


Premium


Premium


Premium


Premium


Premium


Premium


Premium

Explore More Free Stock Images